4
$\begingroup$

I have code:

Plot[y = -3*x + 2, {x, -10, 10}, AspectRatio -> Automatic, 
 PlotRange -> {{-20, 20}, {-20, 20}}]

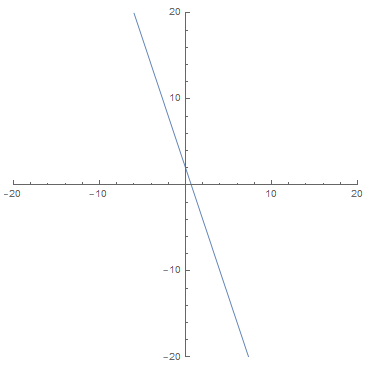
output:

enter image description here

Now I want to use Manipulate[] to manipulate values of this part {x, -10, 10} of the code presented above.

I used different variants like:

Manipulate[
 Plot[y = -3*x + 2, {x, fr1, fr2}, AspectRatio -> Automatic, 
  PlotRange -> {{-20, 20}, {-20, 20}}], {fr1, -10, 10}, {fr2, -10, 
  10}]

without any lack.

Question: How to use Manipulate[] to manipulate values of this part {x, -10, 10} of my first code? I mean manipulate min and max values of x on the plot.

$\endgroup$
7
  • $\begingroup$ If you change fr2 to {fr2, 10} (i.e., set an initial value for that symbol) it will work. $\endgroup$ Commented Mar 31, 2020 at 14:28
  • $\begingroup$ @SjoerdSmit This Manipulate[ Plot[y = -3*x + 2, {x, {fr1, 10}, {fr2, 10}}, AspectRatio -> Automatic, PlotRange -> {{-20, 20}, {-20, 20}}], {fr1, -10, 10}, {fr2, -10, 10} or this Manipulate[ Plot[y = -3*x + 2, {x, fr1, {fr2, 10}}, AspectRatio -> Automatic, PlotRange -> {{-20, 20}, {-20, 20}}], {fr1, -10, 10}, {fr2, -10, 10} does not works. Can you please post corrected whole code? $\endgroup$
    – vasili111
    Commented Mar 31, 2020 at 14:54
  • $\begingroup$ I should've been clearer. You should leave the 1st argument of Manipulate unchanged (i.e., everything inside Plot). You need to change {fr2, -10, 10} to {{fr2, 10}, -10, 10} in the last argument of Manipulate. $\endgroup$ Commented Mar 31, 2020 at 15:17
  • $\begingroup$ @SjoerdSmit That works. Thank you. Complete code: Manipulate[ Plot[y = -3*x + 2, {x, fr1, fr2}, AspectRatio -> Automatic, PlotRange -> {{-20, 20}, {-20, 20}}], {fr1, -10, 10}, {{fr2, 10}, -10, 10}] $\endgroup$
    – vasili111
    Commented Mar 31, 2020 at 15:20
  • $\begingroup$ Final remark: there's no good reason to use y = ... inside of Plot. Just Plot[3*x + 2, {x, fr1, fr2}, ...] will suffice. $\endgroup$ Commented Mar 31, 2020 at 15:22

2 Answers 2

5
$\begingroup$

One way could be

Manipulate[
 Module[{y, x},
  Plot[y = -3*x + 2, {x, from, to},
   AspectRatio -> Automatic,
   PlotRange -> {{from, to}, {from, to}}]
  ],
 {{from, -10, "from"}, -10, -0.01, .01, Appearance -> "Labeled"},
 {{to, 10, "to"}, 0, 10, .01, Appearance -> "Labeled"},
 TrackedSymbols :> {from, to}
 ]
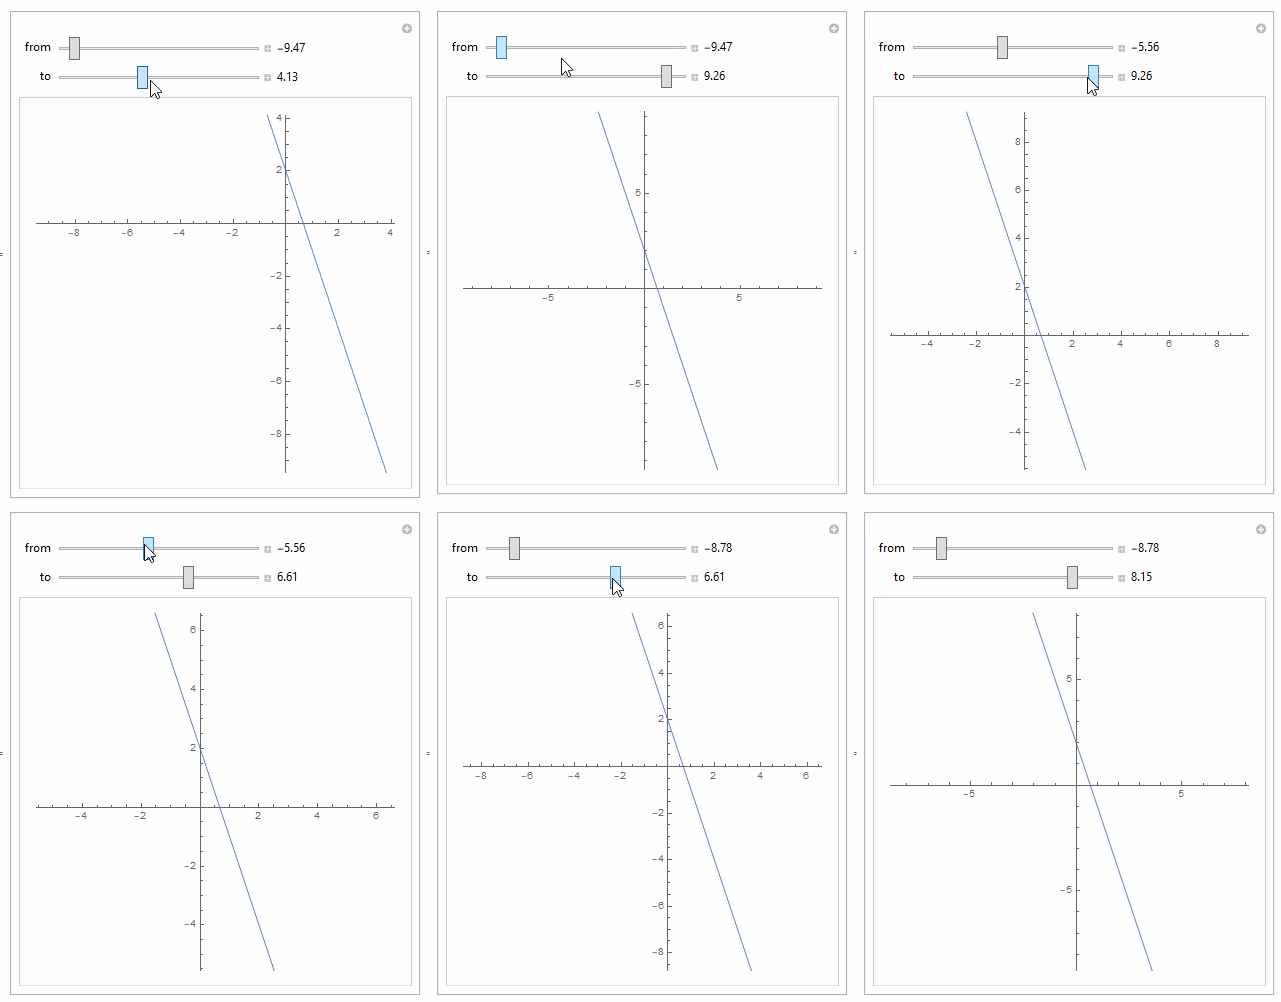
enter image description here

If you meant the from and to only for the x part and not for the plotrange, then you use this

Manipulate[
 Module[{y, x},
  Plot[y = -3*x + 2, {x, from, to},
   AspectRatio -> Automatic,
   PlotRange -> {{-20, 20}, {-20, 20}}]
  ],
 {{from, -10, "from"}, -10, -0.01, .01, Appearance -> "Labeled"},
 {{to, 10, "to"}, 0, 10, .01, Appearance -> "Labeled"},
 TrackedSymbols :> {from, to}
 ]

You just need to make sure the from is not larger than the to, that is all, else Plot complains.

And if you do not want to worry about from being larger than to, then you can add a small check in the code to check for this and adjust automatically, so Plot stays happy.

Manipulate[
 Module[{y, x},

  (*prevent from from going above to to keep plot happy*)
  If[from >= to, from = to - 0.01];

  Plot[y = -3*x + 2, {x, from, to},
   AspectRatio -> Automatic,
   PlotRange -> {{-20, 20}, {-20, 20}}]
  ],
 {{from, -10, "from"}, -10, 10, .01, Appearance -> "Labeled"},
 {{to, 10, "to"}, -10, 10, .01, Appearance -> "Labeled"},
 TrackedSymbols :> {from, to}
 ]
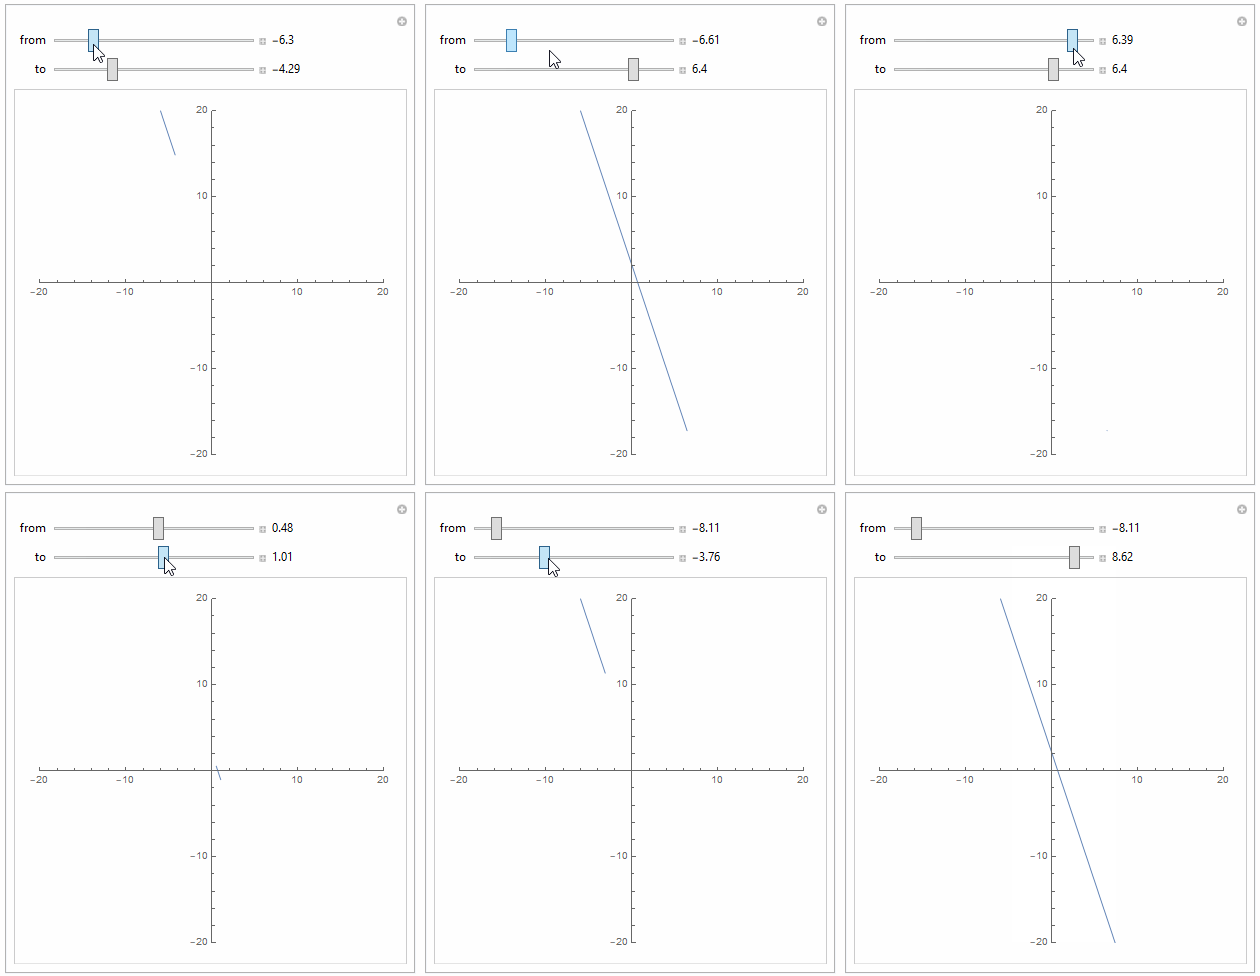
enter image description here

$\endgroup$
1
  • $\begingroup$ Interesting example. Thank you. Is there a way to manipulate not on plot range but on value of x ? I mean plot is fixed and min and max values of x changes with sliders. $\endgroup$
    – vasili111
    Commented Mar 31, 2020 at 2:18
4
$\begingroup$

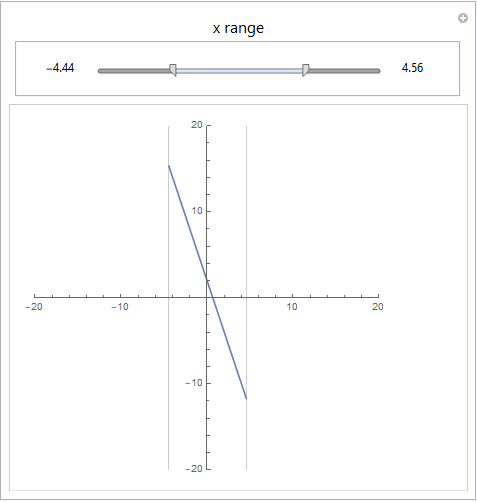
You can use ConditionalExpression to make the input function Undefined outside the desired interval and use IntervalSlider to specify the interval:

Manipulate[Plot[ConditionalExpression[-3*x + 2, r[[1]] <= x <= r[[2]]], {x, -10, 10}, 
    GridLines -> {r, None}, AspectRatio -> Automatic, 
    PlotRange -> {{-20, 20}, {-20, 20}}],
 Panel[Row[{Dynamic @ Pane[r[[1]], Alignment -> Right, ImageSize -> {50, 20}], 
     IntervalSlider[Dynamic[r], {-10, 10}, Method -> "Stop", 
       Appearance -> "Paired", ImageSize -> 300], 
     Dynamic @ Pane[r[[2]], Alignment -> Left, ImageSize -> {50, 20}]}, Spacer[10]], 
    Style["x range", 16], Top], 
 {{r, {-10, 10}, ""}, None}]

enter image description here

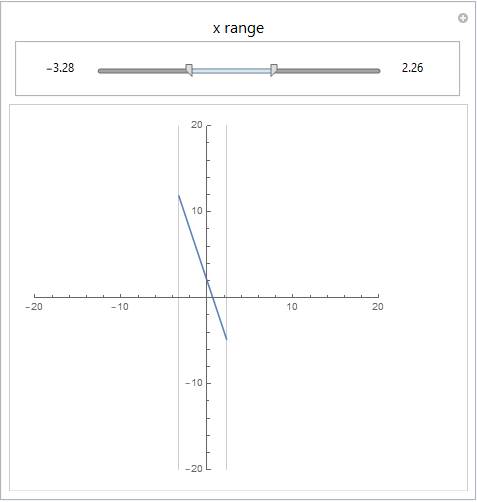
Alternatively, you can use Clipped x values as the argument of the input function:

Manipulate[Plot[-3 Clip[x, r, {Undefined, Undefined}] + 2, {x, -10, 10}, 
    GridLines -> {r, None}, AspectRatio -> Automatic, 
    PlotRange -> {{-20, 20}, {-20, 20}}],
 Panel[Row[{Dynamic @ Pane[r[[1]], Alignment -> Right, ImageSize -> {50, 20}], 
     IntervalSlider[Dynamic[r], {-10, 10}, Method -> "Stop", 
       Appearance -> "Paired", ImageSize -> 300], 
     Dynamic @ Pane[r[[2]], Alignment -> Left, ImageSize -> {50, 20}]}, Spacer[10]], 
    Style["x range", 16], Top], 
 {{r, {-10, 10}, ""}, None}]

enter image description here

$\endgroup$

Your Answer

By clicking “Post Your Answer”, you agree to our terms of service and acknowledge you have read our privacy policy.

Not the answer you're looking for? Browse other questions tagged or ask your own question.