2
$\begingroup$

How can I make Mathematica output a fraction as x/2 as opposed to the x on top with a horizontal bar and 2 on the bottom?

Perhaps I need to work more with Riffle but so far I cannot get it. I have tried concatenating strings, but Mathematica reverses the order of the two elements. Specifically, I am trying to put the symbol theta with a subscript i and then a division by 2. It is going onto a figure, and is very difficult to read with the vertical division.

My code is:

Do[
  alabel[i] = 
   Text[StyleForm[Subscript["\[Theta]", i]/2, FontSize -> 10, 
                  FontColor -> Black, FontFamily -> "Times"], 
        {Re[ww[tt[[3]]]], Im[ww[tt[[3]]]]} + .2 {Cos[aloc3[[i]]], Sin[aloc3[[i]]]}, 
        ioffset[i]]
  , {i, 1, 6}];

th3 = Graphics[Table[alabel[j], {j, 1, 6}]];

(The coordinate ww[[tt[[33]]]] is just some point in the plane).

$\endgroup$
1
  • $\begingroup$ I can't understand what you are trying to accomplish by inserting text with 3D coordinates into a 2D graphics object. Could you clarify your Question regarding that. $\endgroup$
    – m_goldberg
    Commented Oct 7, 2013 at 21:38

3 Answers 3

4
$\begingroup$
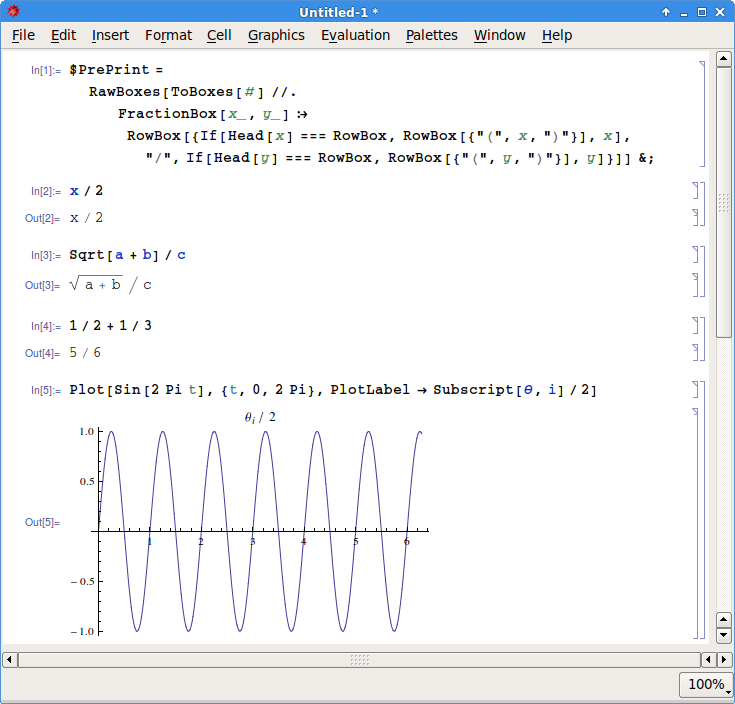
$PrePrint = 
  RawBoxes[ToBoxes[#] //. 
     FractionBox[x_, y_] :> 
      RowBox[{If[Head[x] === RowBox, RowBox[{"(", x, ")"}], x], "/", 
        If[Head[y] === RowBox, RowBox[{"(", y, ")"}], y]}]] &;

Then every fraction in your output will be of the form x/y.

For example:

enter image description here

$\endgroup$
2
$\begingroup$

Assuming you want your labels inserted into a 2D Graphic, it can be done like this:

With[{n = 3},
  Module[{pts, lbls},
    SeedRandom@1; pts = RandomReal[1., {n, 2}];
    lbls = 
      Table[
        Text[Row[{Subscript[θ, i], "/\[ThinSpace]2"}, "", 
          BaseStyle -> {"TR", 10}], pts[[i]]], 
        {i, Range @ n}];
    Framed @ Graphics[lbls]]]

lbls.png

The salient points in the above example are in the use of Row with the option BaseStyle and in adding a \[ThinSpace] to adjust the spacing between the slash and the denominator 2. Without the \[ThinSpace] the text looks too tight.

$\endgroup$
1
$\begingroup$

Here's a way to get the slash to not be written in the standard form:

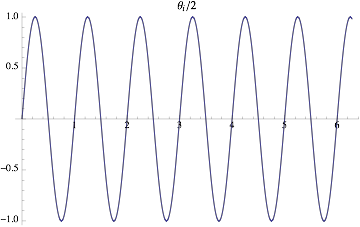
Plot[Sin[2 Pi t], {t, 0, 2 Pi}, PlotLabel -> Row[{Subscript[θ, i], "/", 2}]]

enter image description here

$\endgroup$

Your Answer

By clicking “Post Your Answer”, you agree to our terms of service and acknowledge you have read our privacy policy.

Not the answer you're looking for? Browse other questions tagged or ask your own question.