The phase information follows from the optimal trigonometric approximation
![X\[\[CapitalOmega\]\]\[t\]~a+b Sin\[\[CapitalOmega t+phase\]=a+c Cos\[\[CapitalOmega t\]+s Sin\[\[CapitalOmega t\]](https://i.sstatic.net/M7xcJ.png)
(fundamentals of FourierSeries)
Clear["Global`*"]
k = 7/5; f = 1/5; β = 3/100;
tmax = 20;

sys = {
x''[t]*x[t] + 3/2*x'[t]^2 ==x[t]^(-3*k) - 1 - 4*β*x'[t]/x[t] + f*Sin[Ω*t],
x[0] == 1, x'[0] == 0} // Simplify;

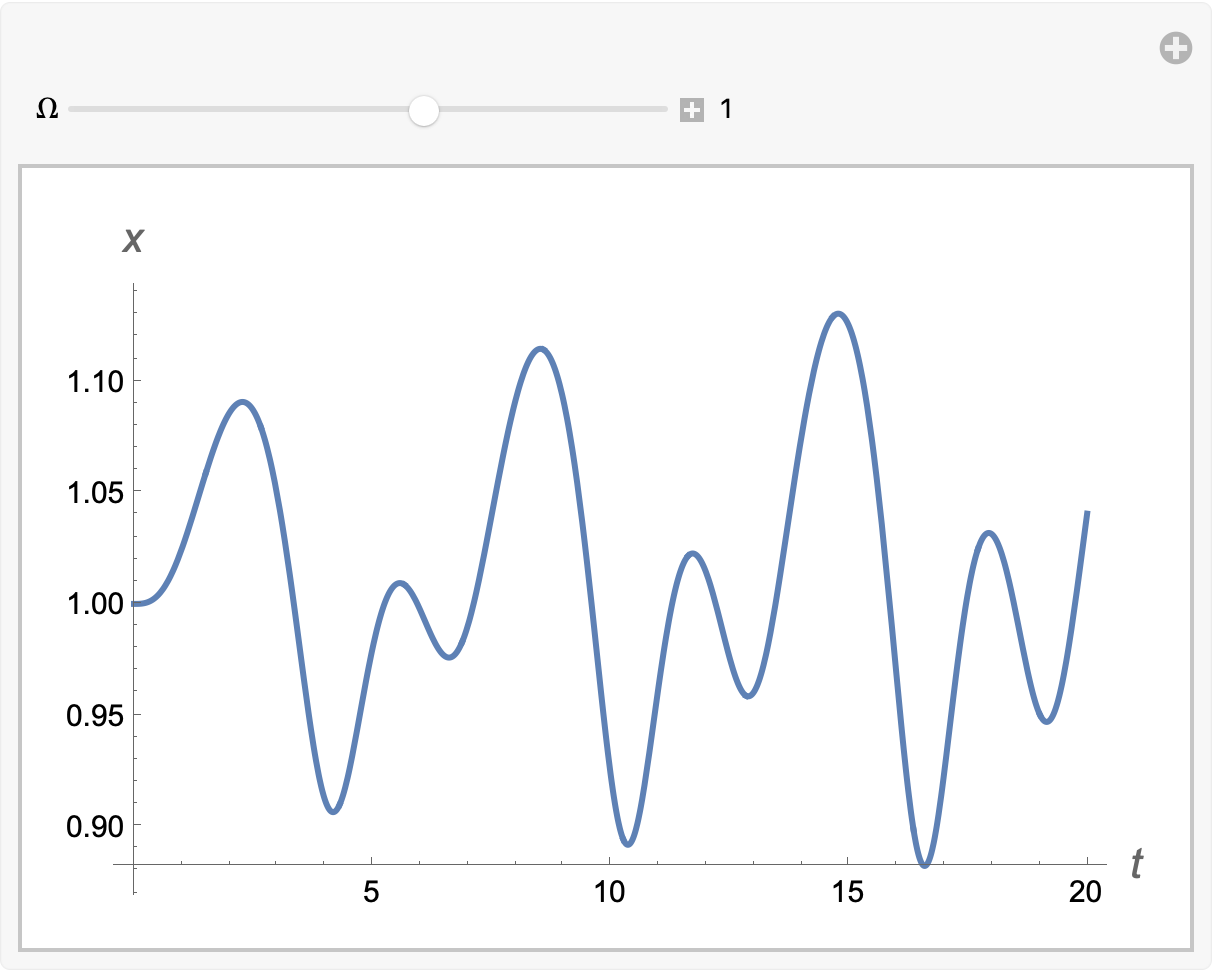
X= ParametricNDSolveValue[sys, x, {t, 0, tmax}, {Ω}]
Thanks @BobHanlon for these code lines!
phase[\[CapitalOmega]_?NumericQ] :=
Block[{acs,
M = NIntegrate[Outer[Times, {1, Cos[\[CapitalOmega] t],Sin[\[CapitalOmega] t]}, {1, Cos[\[CapitalOmega] t],Sin[\[CapitalOmega] t]}], {t, 0, tmax},Method -> "LocalAdaptive"],
rS = NIntegrate[X[\[CapitalOmega]][t] {1, Cos[\[CapitalOmega] t],Sin[\[CapitalOmega] t]}, {t, 0, tmax},Method -> "LocalAdaptive"]},
acs = LinearSolve[M, rS ];
ArcTan[acs[[2]], acs[[3]]]]
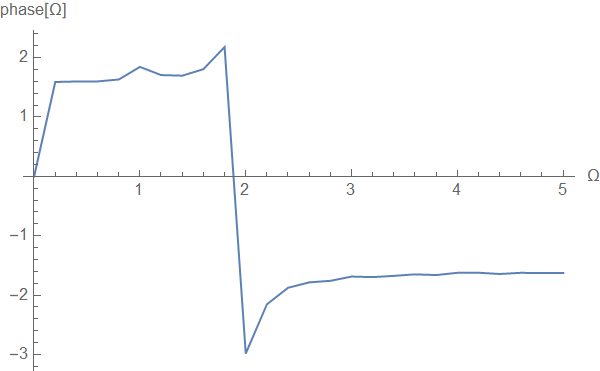
plot result
zw = Table[{\[CapitalOmega],phase[\[CapitalOmega]]}, {\[CapitalOmega], Subdivide[0 , 5, 25]}]

ListPlot[zw, Joined -> True,AxesLabel -> {\[CapitalOmega], "phase[\[CapitalOmega]]"}]


![X\[\[CapitalOmega\]\]\[t\]~a+b Sin\[\[CapitalOmega t+phase\]=a+c Cos\[\[CapitalOmega t\]+s Sin\[\[CapitalOmega t\]](https://i.sstatic.net/M7xcJ.png)


\[CapitalOmega]is the forcing frequency. $\endgroup$x[0]=1andx'[0]=0. I want to plot it for the steady state condition and\[CapitalOmega]is varying from-5to5. $\endgroup$