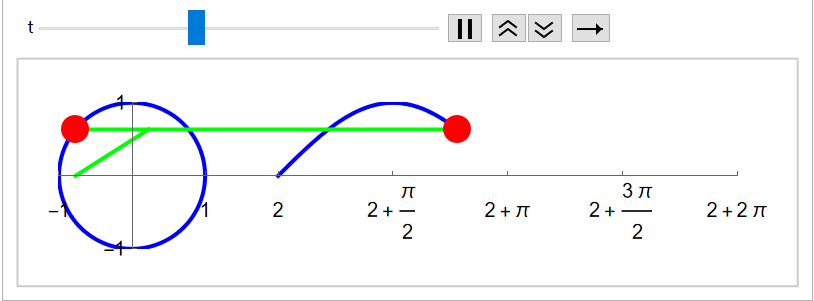
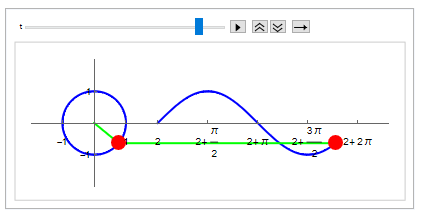
What are the issues with the dynamic image code generated by sine curves? How to modify and improve it?
BX[t_] :=
  Module[{g1, g2, g3, g4, r},
   g1 = ParametricPlot[{{Cos[2 \[Pi] r],
       Sin[2 \[Pi] r]}, {2 + \[Pi] t r/64, Sin[\[Pi] t r/64]}}, {r, 0,
       1}, PlotStyle -> {RGBColor[0, 0, 1]},
     Ticks -> {{-1, 0, 1, 2, 2 + \[Pi]/2, 2 + \[Pi], 2 + 3 \[Pi]/2,
        2 + 2 \[Pi]}, {-1, 0, 1}},
     PlotRange -> {{-1, 2 + 2 \[Pi]}, {-1, 1}}];
   g2 = ParametricPlot[{{r + Cos[\[Pi] t/64],
       r Sin[\[Pi] t/64]}, {r (2 + \[Pi] t/64) + (1 -
           r) Cos[\[Pi] t/64], Sin[\[Pi] t/64]}}, {r, 0, 1},
     PlotStyle -> {RGBColor[0, 1, 0]}];
   g3 = Graphics[{PointSize[0.04], RGBColor[1, 0, 0],
      Point[{2 + \[Pi] t/64, Sin[\[Pi] t/64]}]}];
   g4 = Graphics[{PointSize[0.04], RGBColor[1, 0, 0],
      Point[{Cos[\[Pi] t/64], Sin[\[Pi] t/64]}]}];
   Show[g1, g2, g3, g4, AspectRatio -> Automatic]];
Animate[BX[t], {t, 0, 128, 1}]
How to make the code more concise and the graphics more aesthetically pleasing


PlotRangePadding -> 1in g1 will prevent the clipping $\endgroup$