added 80 characters in body
Source Link
csn899
  • 1
  • 6
  • 17

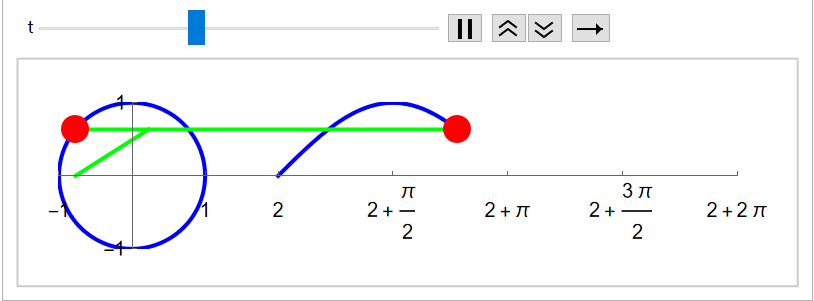
What are the issues with the dynamic image code generated by sine curves? How to modify and improve it?

BX[t_] := 
  Module[{g1, g2, g3, g4, r}, 
   g1 = ParametricPlot[{{Cos[2 \[Pi] r], 
       Sin[2 \[Pi] r]}, {2 + \[Pi] t r/64, Sin[\[Pi] t r/64]}}, {r, 0,
       1}, PlotStyle -> {RGBColor[0, 0, 1]}, 
     Ticks -> {{-1, 0, 1, 2, 2 + \[Pi]/2, 2 + \[Pi], 2 + 3 \[Pi]/2, 
        2 + 2 \[Pi]}, {-1, 0, 1}}, 
     PlotRange -> {{-1, 2 + 2 \[Pi]}, {-1, 1}}]; 
   g2 = ParametricPlot[{{r + Cos[\[Pi] t/64], 
       r Sin[\[Pi] t/64]}, {r (2 + \[Pi] t/64) + (1 - 
           r) Cos[\[Pi] t/64], Sin[\[Pi] t/64]}}, {r, 0, 1}, 
     PlotStyle -> {RGBColor[0, 1, 0]}]; 
   g3 = Graphics[{PointSize[0.04], RGBColor[1, 0, 0], 
      Point[{2 + \[Pi] t/64, Sin[\[Pi] t/64]}]}]; 
   g4 = Graphics[{PointSize[0.04], RGBColor[1, 0, 0], 
      Point[{Cos[\[Pi] t/64], Sin[\[Pi] t/64]}]}]; 
   Show[g1, g2, g3, g4, AspectRatio -> Automatic]];
Animate[BX[t], {t, 0, 128, 1}]

enter image description here

How to make the code more concise and the graphics more aesthetically pleasing

What are the issues with the dynamic image code generated by sine curves? How to modify and improve it?

BX[t_] := 
  Module[{g1, g2, g3, g4, r}, 
   g1 = ParametricPlot[{{Cos[2 \[Pi] r], 
       Sin[2 \[Pi] r]}, {2 + \[Pi] t r/64, Sin[\[Pi] t r/64]}}, {r, 0,
       1}, PlotStyle -> {RGBColor[0, 0, 1]}, 
     Ticks -> {{-1, 0, 1, 2, 2 + \[Pi]/2, 2 + \[Pi], 2 + 3 \[Pi]/2, 
        2 + 2 \[Pi]}, {-1, 0, 1}}, 
     PlotRange -> {{-1, 2 + 2 \[Pi]}, {-1, 1}}]; 
   g2 = ParametricPlot[{{r + Cos[\[Pi] t/64], 
       r Sin[\[Pi] t/64]}, {r (2 + \[Pi] t/64) + (1 - 
           r) Cos[\[Pi] t/64], Sin[\[Pi] t/64]}}, {r, 0, 1}, 
     PlotStyle -> {RGBColor[0, 1, 0]}]; 
   g3 = Graphics[{PointSize[0.04], RGBColor[1, 0, 0], 
      Point[{2 + \[Pi] t/64, Sin[\[Pi] t/64]}]}]; 
   g4 = Graphics[{PointSize[0.04], RGBColor[1, 0, 0], 
      Point[{Cos[\[Pi] t/64], Sin[\[Pi] t/64]}]}]; 
   Show[g1, g2, g3, g4, AspectRatio -> Automatic]];
Animate[BX[t], {t, 0, 128, 1}]

enter image description here

How to make the code more concise and the graphics more aesthetically pleasing
added 87 characters in body
Source Link
csn899
  • 1
  • 6
  • 17

What are the issues with the dynamic image code generated by sine curves? How to modify and improve it?

BX[t_] := 
  Module[{g1, g2, g3, g4, r}, 
   g1 = ParametricPlot[{{Cos[2 \[Pi] r], 
       Sin[2 \[Pi] r]}, {2 + \[Pi] t r/64, Sin[\[Pi] t r/64]}}, {r, 0,
       1}, PlotStyle -> {RGBColor[0, 0, 1]}, 
     Ticks -> {{-1, 0, 1, 2, 2 + \[Pi]/2, 2 + \[Pi], 2 + 3 \[Pi]/2, 
        2 + 2 \[Pi]}, {-1, 0, 1}}, 
     PlotRange -> {{-1, 2 + 2 \[Pi]}, {-1, 1}}]; 
   g2 = ParametricPlot[{{r + Cos[\[Pi] t/64], 
       r Sin[\[Pi] t/64]}, {r (2 + \[Pi] t/64) + (1 - 
           r) Cos[\[Pi] t/64], Sin[\[Pi] t/64]}}, {r, 0, 1}, 
     PlotStyle -> {RGBColor[0, 1, 0]}]; 
   g3 = Graphics[{PointSize[0.04], RGBColor[1, 0, 0], 
      Point[{2 + \[Pi] t/64, Sin[\[Pi] t/64]}]}]; 
   g4 = Graphics[{PointSize[0.04], RGBColor[1, 0, 0], 
      Point[{Cos[\[Pi] t/64], Sin[\[Pi] t/64]}]}]; 
   Show[g1, g2, g3, g4, AspectRatio -> Automatic]];
Animate[BX[t], {t, 0, 128, 1}]

enter image description here

What are the issues with the dynamic image code generated by sine curves? How to modify and improve it?

BX[t_] := 
  Module[{g1, g2, g3, g4, r}, 
   g1 = ParametricPlot[{{Cos[2 \[Pi] r], 
       Sin[2 \[Pi] r]}, {2 + \[Pi] t r/64, Sin[\[Pi] t r/64]}}, {r, 0,
       1}, PlotStyle -> {RGBColor[0, 0, 1]}, 
     Ticks -> {{-1, 0, 1, 2, 2 + \[Pi]/2, 2 + \[Pi], 2 + 3 \[Pi]/2, 
        2 + 2 \[Pi]}, {-1, 0, 1}}, 
     PlotRange -> {{-1, 2 + 2 \[Pi]}, {-1, 1}}]; 
   g2 = ParametricPlot[{{r + Cos[\[Pi] t/64], 
       r Sin[\[Pi] t/64]}, {r (2 + \[Pi] t/64) + (1 - 
           r) Cos[\[Pi] t/64], Sin[\[Pi] t/64]}}, {r, 0, 1}, 
     PlotStyle -> {RGBColor[0, 1, 0]}]; 
   g3 = Graphics[{PointSize[0.04], RGBColor[1, 0, 0], 
      Point[{2 + \[Pi] t/64, Sin[\[Pi] t/64]}]}]; 
   g4 = Graphics[{PointSize[0.04], RGBColor[1, 0, 0], 
      Point[{Cos[\[Pi] t/64], Sin[\[Pi] t/64]}]}]; 
   Show[g1, g2, g3, g4, AspectRatio -> Automatic]];
Animate[BX[t], {t, 0, 128, 1}]

enter image description here

Source Link
csn899
  • 1
  • 6
  • 17

What are the issues with the dynamic image code generated by sine curves? How to modify and improve it?

What are the issues with the dynamic image code generated by sine curves? How to modify and improve it?

BX[t_] := 
  Module[{g1, g2, g3, g4, r}, 
   g1 = ParametricPlot[{{Cos[2 \[Pi] r], 
       Sin[2 \[Pi] r]}, {2 + \[Pi] t r/64, Sin[\[Pi] t r/64]}}, {r, 0,
       1}, PlotStyle -> {RGBColor[0, 0, 1]}, 
     Ticks -> {{-1, 0, 1, 2, 2 + \[Pi]/2, 2 + \[Pi], 2 + 3 \[Pi]/2, 
        2 + 2 \[Pi]}, {-1, 0, 1}}, 
     PlotRange -> {{-1, 2 + 2 \[Pi]}, {-1, 1}}]; 
   g2 = ParametricPlot[{{r + Cos[\[Pi] t/64], 
       r Sin[\[Pi] t/64]}, {r (2 + \[Pi] t/64) + (1 - 
           r) Cos[\[Pi] t/64], Sin[\[Pi] t/64]}}, {r, 0, 1}, 
     PlotStyle -> {RGBColor[0, 1, 0]}]; 
   g3 = Graphics[{PointSize[0.04], RGBColor[1, 0, 0], 
      Point[{2 + \[Pi] t/64, Sin[\[Pi] t/64]}]}]; 
   g4 = Graphics[{PointSize[0.04], RGBColor[1, 0, 0], 
      Point[{Cos[\[Pi] t/64], Sin[\[Pi] t/64]}]}]; 
   Show[g1, g2, g3, g4, AspectRatio -> Automatic]];
Animate[BX[t], {t, 0, 128, 1}]