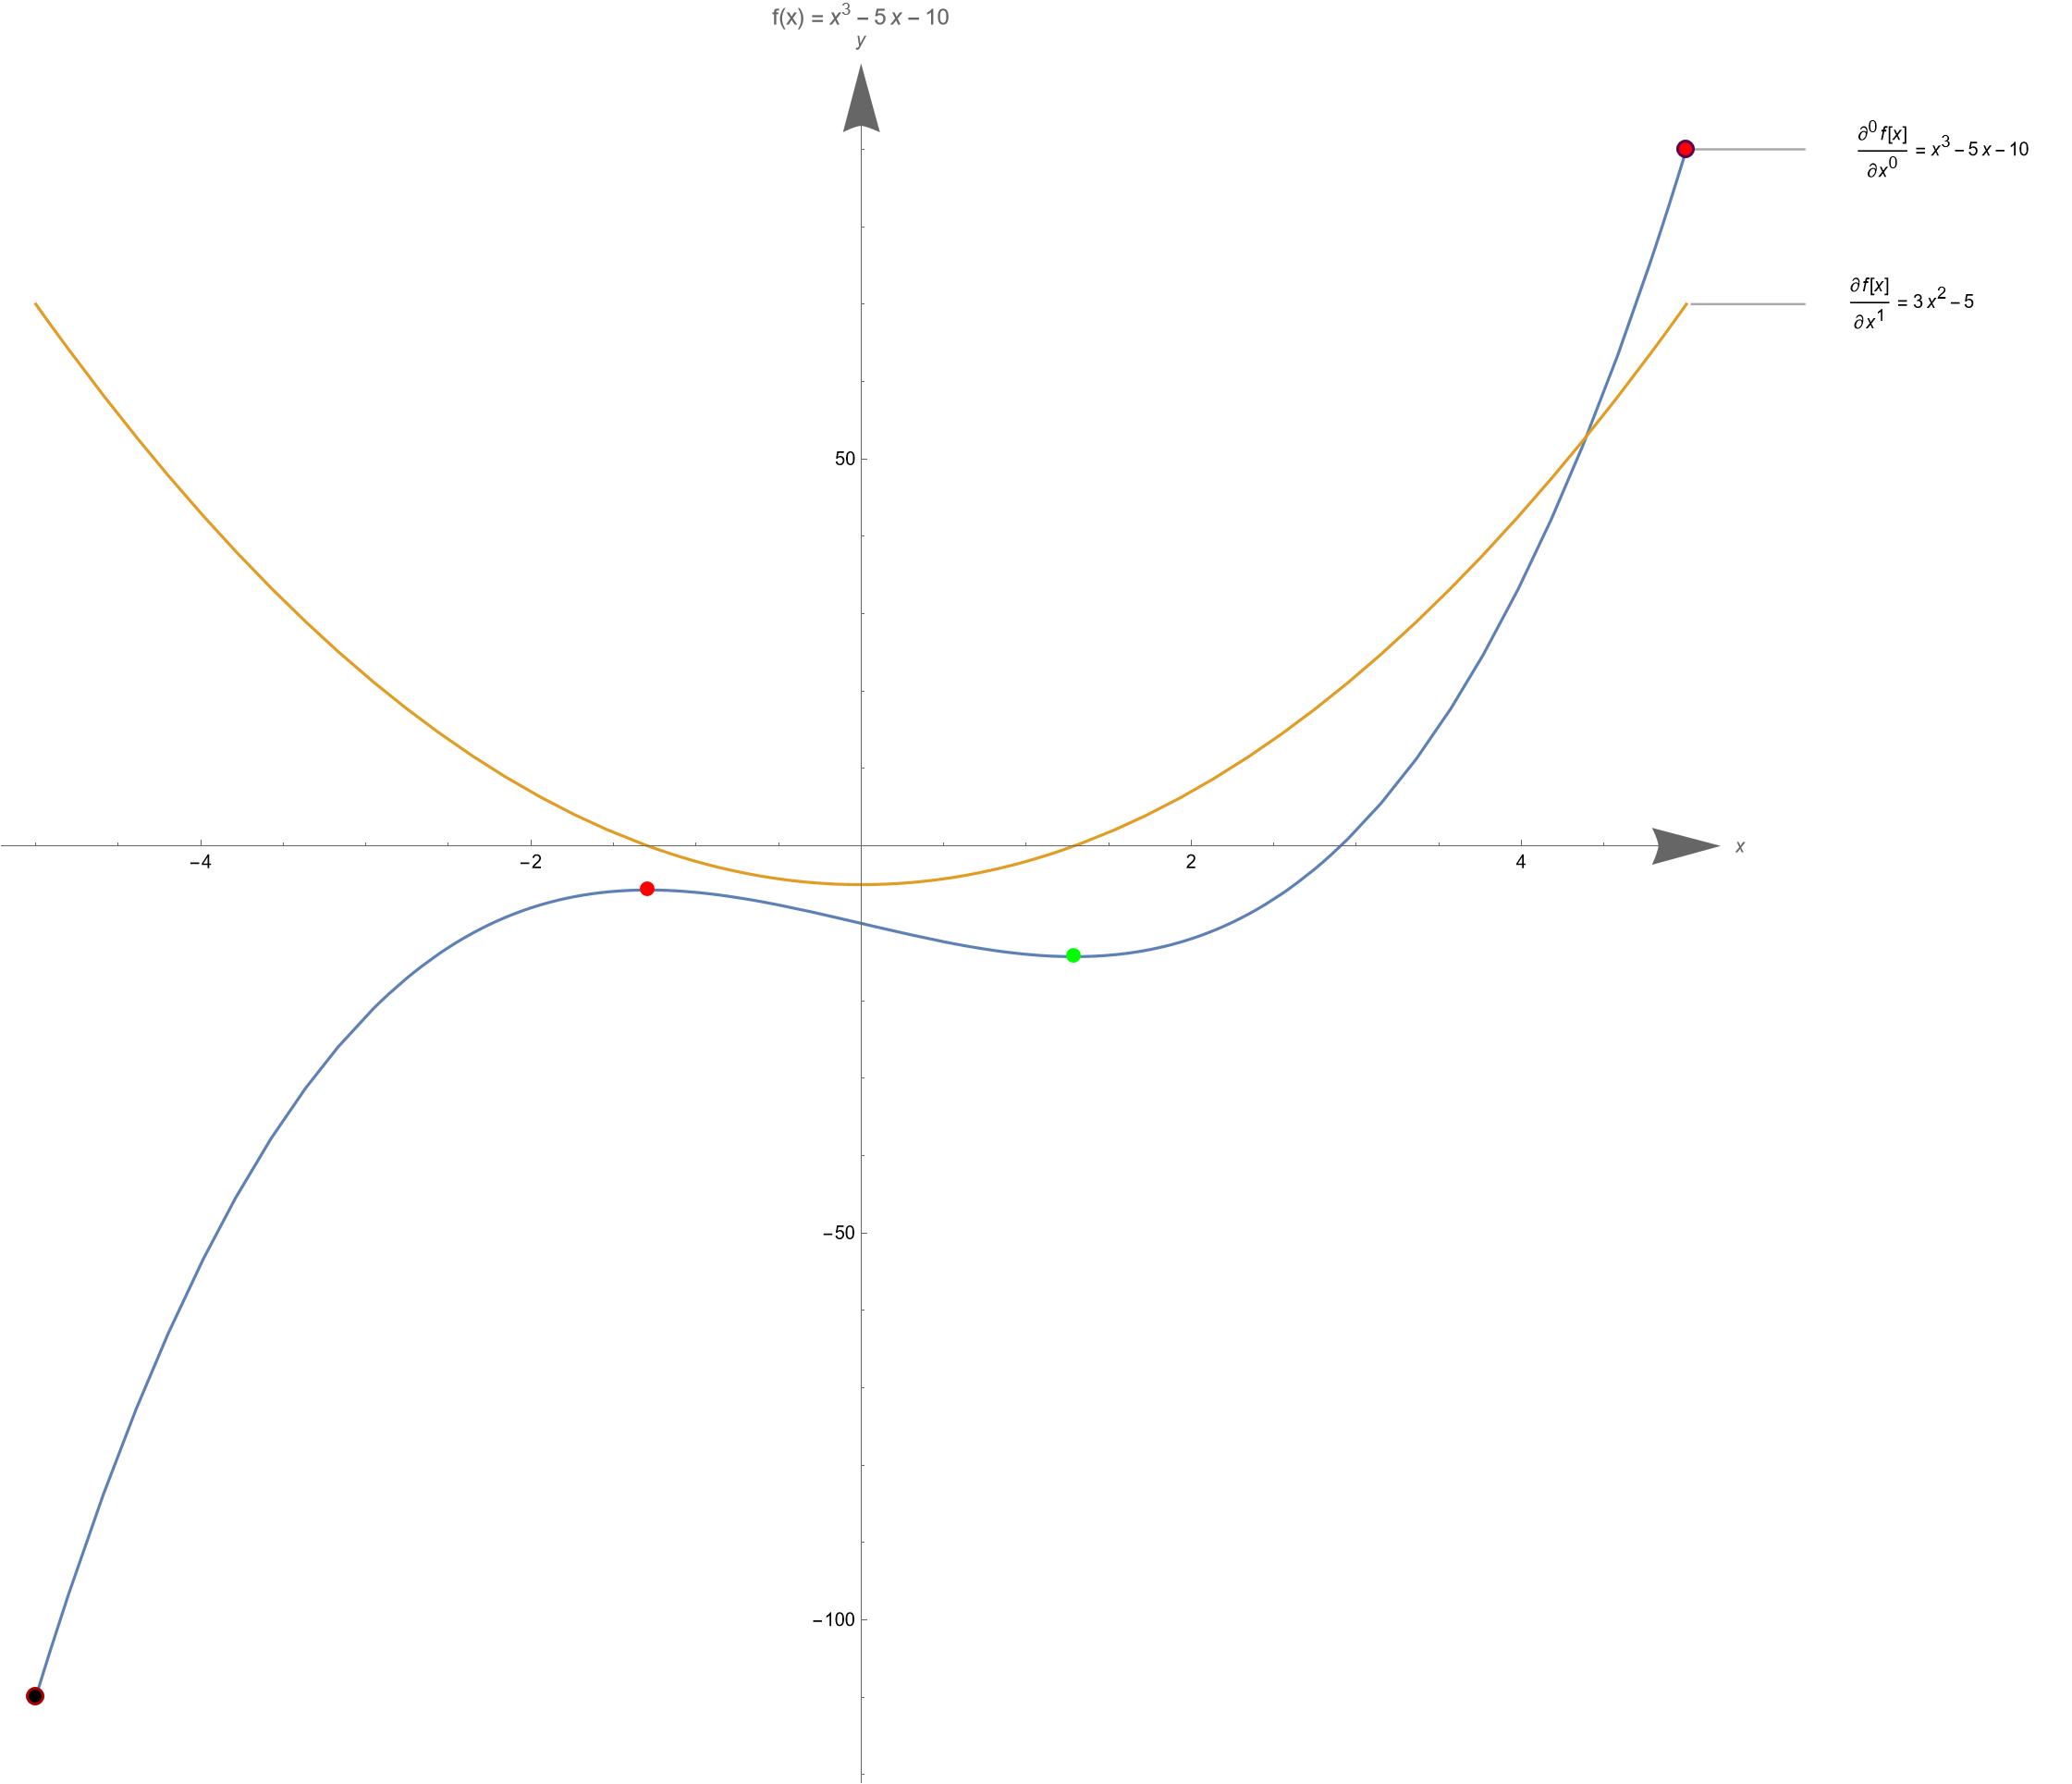
ClearAll["`*"];
f[x_] := x^3 - 5 x - 10
D[f[x], x] // FullSimplify
xr = -5 <= x <= 5
Solve[D[f[x], x] == 0, x, Reals]
NSolve[D[f[x], x] == 0 && xr, x, Reals]
gmax = Maximize[{f[x], xr}, x]
gmin = Minimize[{f[x], xr}, x]
lmax = Solve[{D[f[x], x] == 0, D[f[x], {x, 2}] < 0, xr}, x]
lmaxv = {x, f[x]} /. lmax[[1]] // FullSimplify
lmin = Solve[{D[f[x], x] == 0, D[f[x], {x, 2}] > 0, xr}, x]
lminv = {x, f[x]} /. lmin[[1]] // FullSimplify
Manipulate[
 Refresh[functions =
   Table[D[f[x], {x, n}], {n, 0, nMax, 1}] // FullSimplify;
  orders =
   Table[D[f[x], {x, n}] // Inactivate // TraditionalForm //
     ToString, {n, 0, nMax, 1}];
  labels =
   MapThread[#1 <> " = " <> ToString[#2, TraditionalForm] &, {orders,
     functions}];];
 Plot[{functions}, {x, -5, 5},
  Epilog -> {{Darker@Purple, AbsolutePointSize[10],
     Point[{x, f[x]} /. gmax[[2]]], AbsolutePointSize[7], Red,
     Point[{x, f[x]} /. gmax[[2]]]}, {Darker@Red,
     AbsolutePointSize[10], Point[{x, f[x]} /. gmin[[2]]],
     AbsolutePointSize[7], Black, Point[{x, f[x]} /. gmin[[2]]]},
    AbsolutePointSize[8], Green, Point[{x, f[x]} /. lmin], Red,
    Point[{x, f[x]} /. lmax]}, PlotLabels -> labels,
  AxesStyle -> Arrowheads[{0.0, 0.04}], AxesLabel -> {x, y},
  ImageSize -> Full, AspectRatio -> 1,
  PlotLabel -> Row[{"f(x) = ", f[x]}]], {{nMax, 1, "Order"}, 1, 10, 1,
   PopupMenu}]
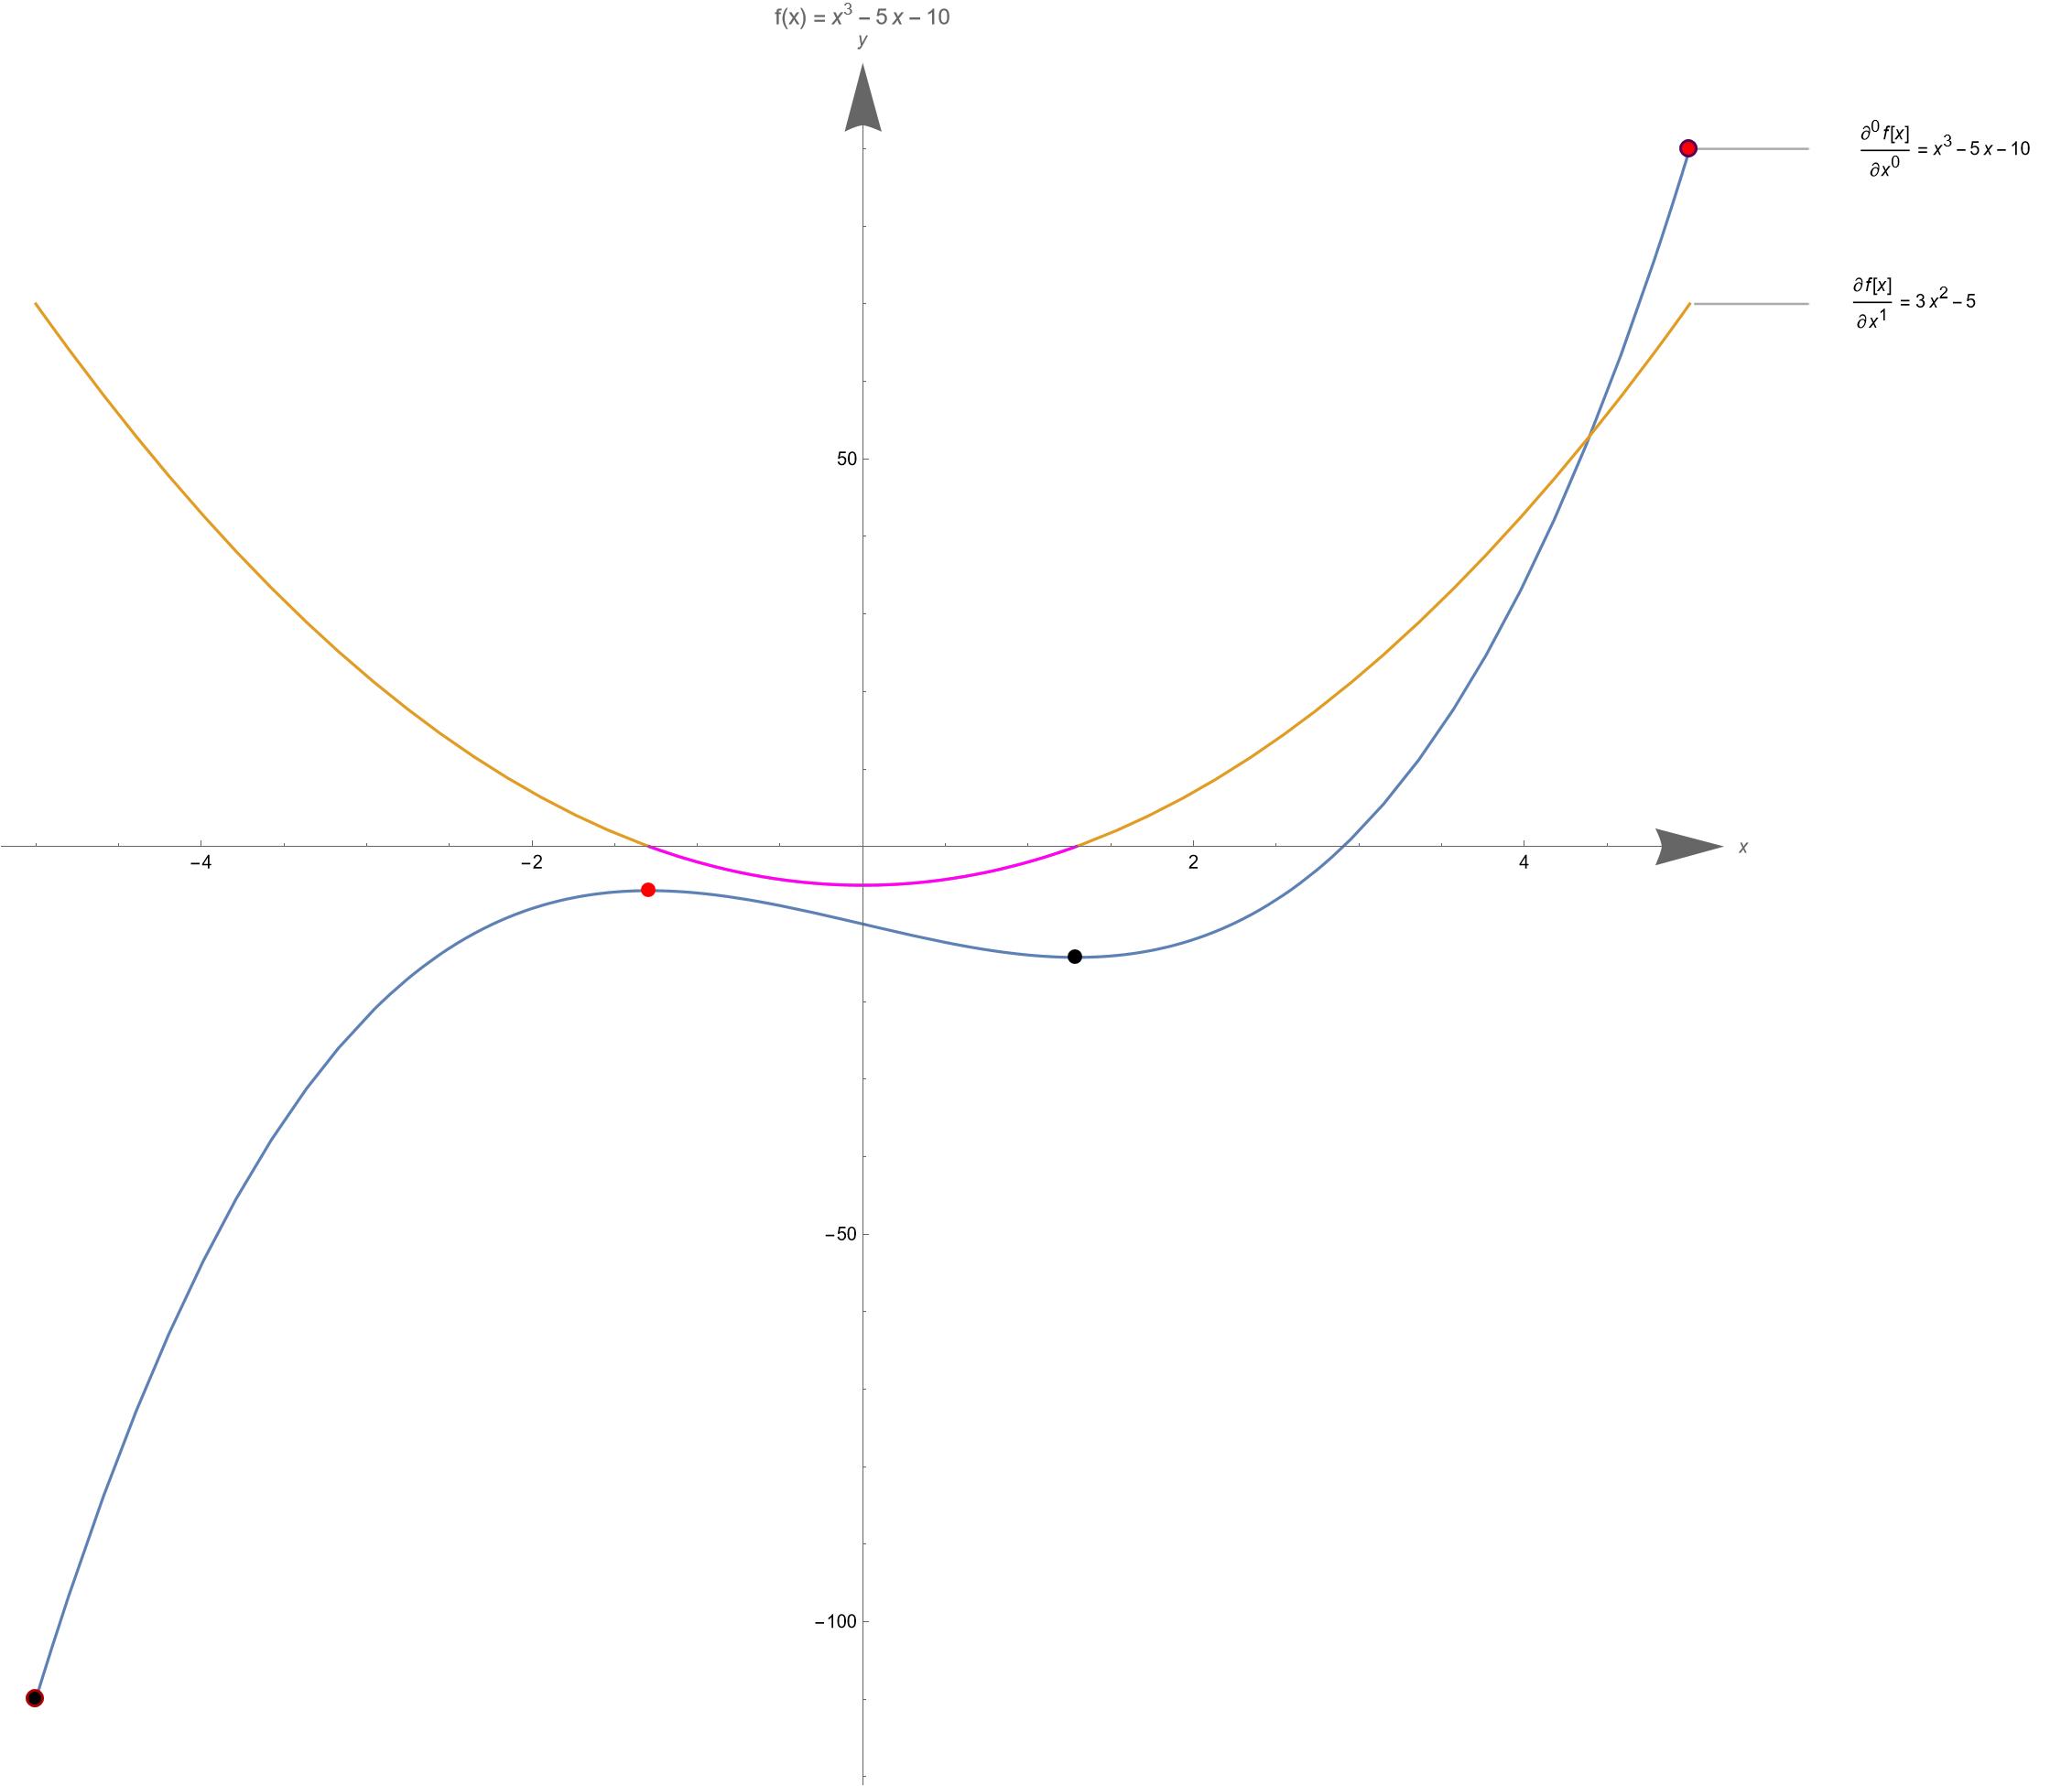
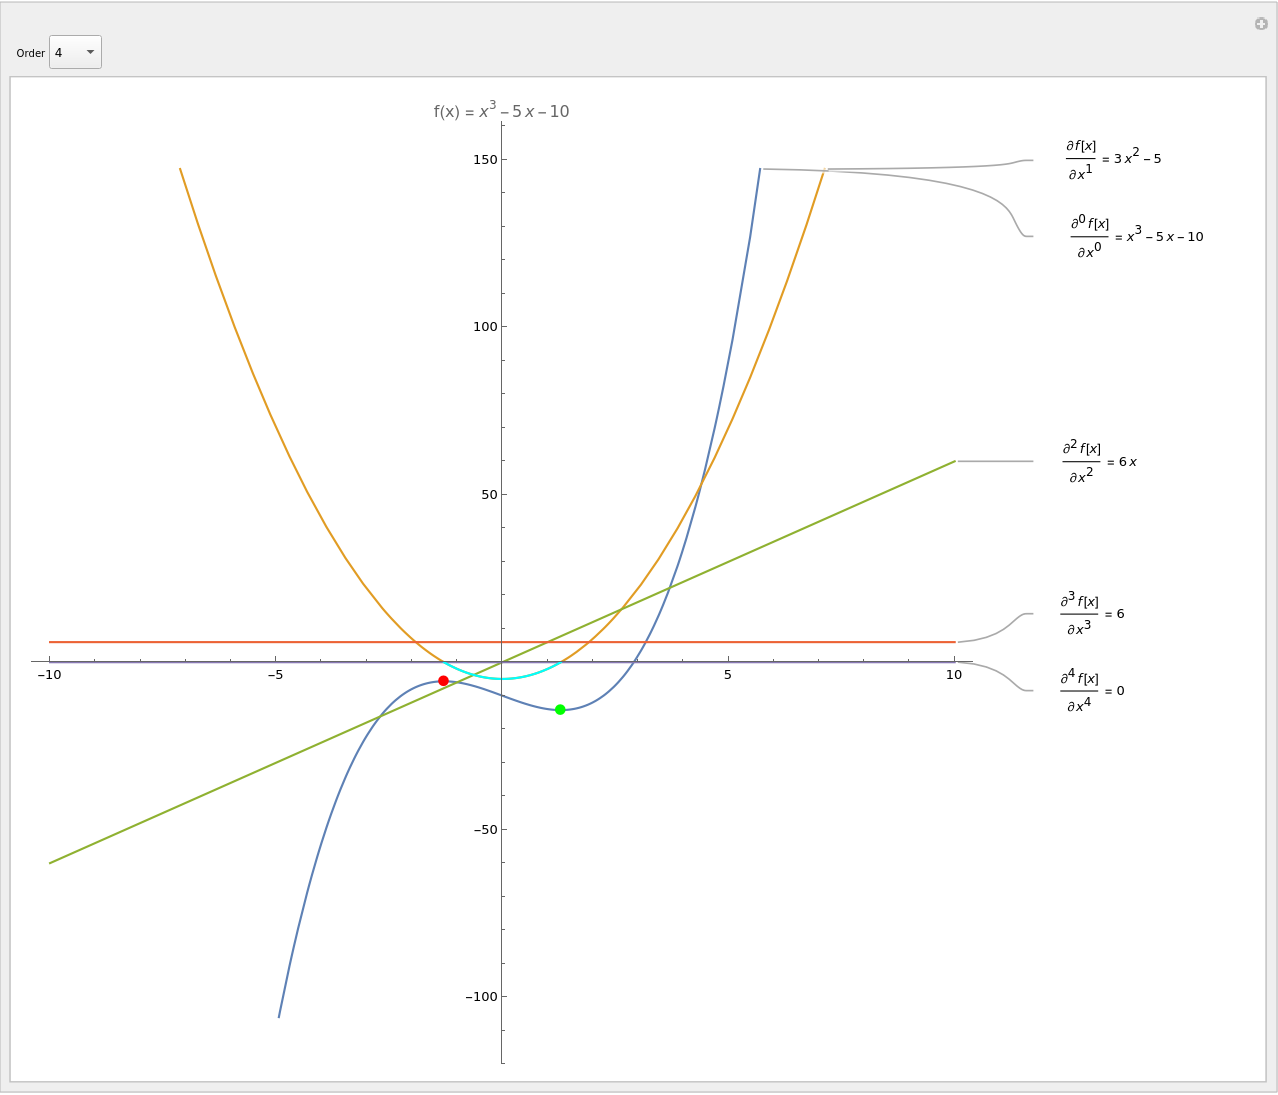
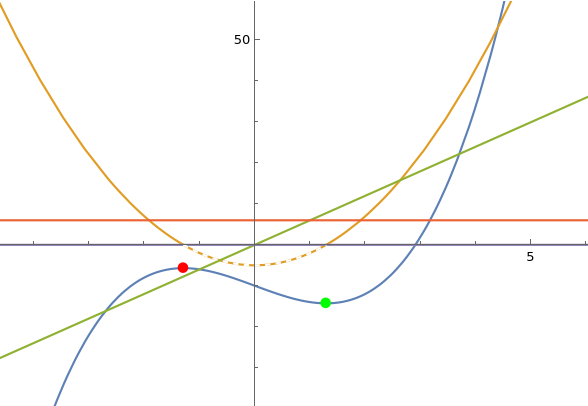
How to modify this code so that the first derivative image of the function displays different colors above and below the x-axis?
Update 1 based on kglr:
ClearAll["`*"];
f[x_] := x^3 - 5 x - 10
D[f[x], x] // FullSimplify
xr = -5 <= x <= 5
Solve[D[f[x], x] == 0, x, Reals]
NSolve[D[f[x], x] == 0 && xr, x, Reals]
gmax = Maximize[{f[x], xr}, x]
gmin = Minimize[{f[x], xr}, x]
lmax = Solve[{D[f[x], x] == 0, D[f[x], {x, 2}] < 0, xr}, x]
lmaxv = {x, f[x]} /. lmax[[1]] // FullSimplify
lmin = Solve[{D[f[x], x] == 0, D[f[x], {x, 2}] > 0, xr}, x]
lminv = {x, f[x]} /. lmin[[1]] // FullSimplify
Manipulate[
 Refresh[functions =
   Table[D[f[x], {x, n}], {n, 0, nMax, 1}] // FullSimplify;
  orders =
   Table[D[f[x], {x, n}] // Inactivate // TraditionalForm //
     ToString, {n, 0, nMax, 1}];
  labels =
   MapThread[#1 <> " = " <> ToString[#2, TraditionalForm] &, {orders,
     functions}];];
 Plot[Evaluate@
   Append[functions,
    Style[ConditionalExpression[functions[[2]], functions[[2]] <= 0],
     RGBColor[1, 0, 1]]], {x, -5, 5},
  Epilog -> {{Darker@Purple, AbsolutePointSize[10],
     Point[{x, f[x]} /. gmax[[2]]], AbsolutePointSize[7], Red,
     Point[{x, f[x]} /. gmax[[2]]]}, {Darker@Red,
     AbsolutePointSize[10], Point[{x, f[x]} /. gmin[[2]]],
     AbsolutePointSize[7], Black, Point[{x, f[x]} /. gmin[[2]]]},
    AbsolutePointSize[8], Black, Point[{x, f[x]} /. lmin], Red,
    Point[{x, f[x]} /. lmax]}, PlotLabels -> labels,
  AxesStyle -> Arrowheads[{0.0, 0.04}], AxesLabel -> {x, y},
  ImageSize -> Full, AspectRatio -> 1,
  PlotLabel -> Row[{"f(x) = ", f[x]}]], {{nMax, 1, "Order"}, 1, 10, 1,
   PopupMenu}]


