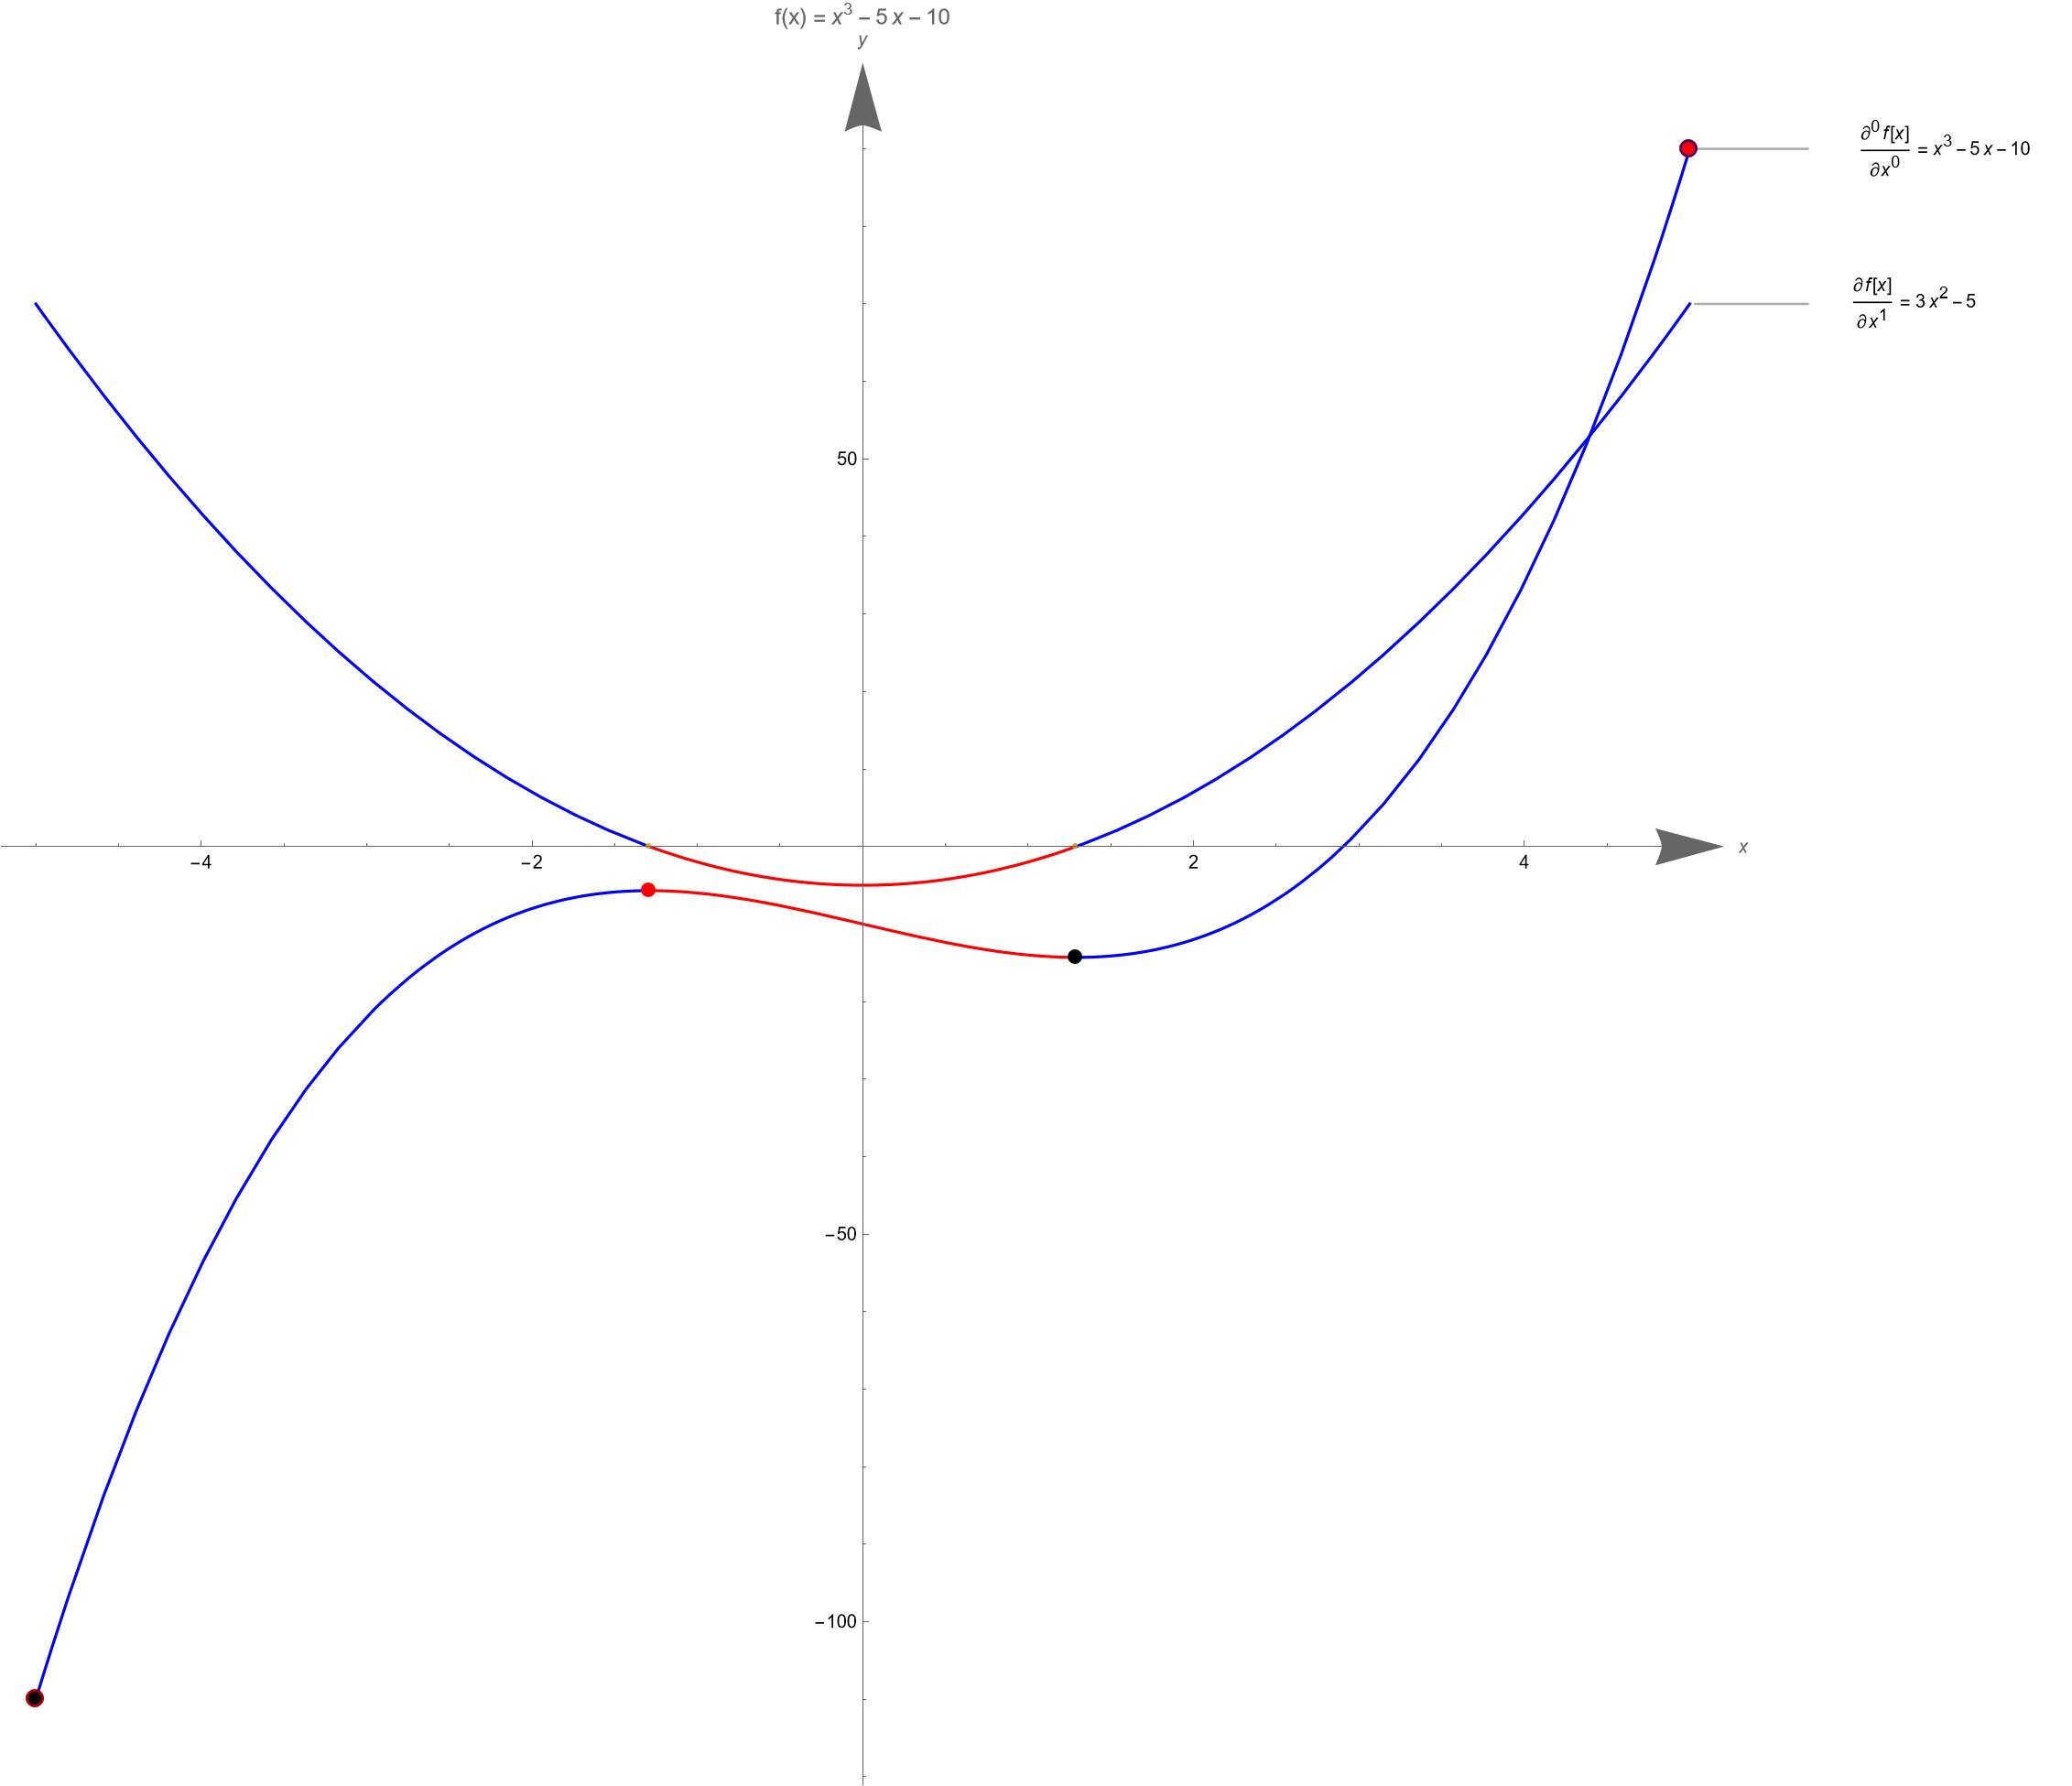
Based on Michael E2's comments in the above post, the following code and images are obtained:
ClearAll["`*"];
f[x_] := x^3 - 5 x - 10
D[f[x], x] // FullSimplify
xr = -5 <= x <= 5
Solve[D[f[x], x] == 0, x, Reals]
NSolve[D[f[x], x] == 0 && xr, x, Reals]
gmax = Maximize[{f[x], xr}, x]
gmin = Minimize[{f[x], xr}, x]
lmax = Solve[{D[f[x], x] == 0, D[f[x], {x, 2}] < 0, xr}, x]
lmaxv = {x, f[x]} /. lmax[[1]] // FullSimplify
lmin = Solve[{D[f[x], x] == 0, D[f[x], {x, 2}] > 0, xr}, x]
lminv = {x, f[x]} /. lmin[[1]] // FullSimplify
Manipulate[
 Refresh[functions =
   Table[D[f[x], {x, n}], {n, 0, nMax, 1}] // FullSimplify;
  orders =
   Table[D[f[x], {x, n}] // Inactivate // TraditionalForm //
     ToString, {n, 0, nMax, 1}];
  labels =
   MapThread[#1 <> " = " <> ToString[#2, TraditionalForm] &, {orders,
     functions}];];
 Plot[{functions}, {x, -5, 5},
  Epilog -> {{Darker@Purple, AbsolutePointSize[10],
     Point[{x, f[x]} /. gmax[[2]]], AbsolutePointSize[7], Red,
     Point[{x, f[x]} /. gmax[[2]]]}, {Darker@Red,
     AbsolutePointSize[10], Point[{x, f[x]} /. gmin[[2]]],
     AbsolutePointSize[7], Black, Point[{x, f[x]} /. gmin[[2]]]},
    AbsolutePointSize[8], Black, Point[{x, f[x]} /. lmin], Red,
    Point[{x, f[x]} /. lmax]}, PlotLabels -> labels,
  AxesStyle -> Arrowheads[{0.0, 0.04}], AxesLabel -> {x, y},
  ImageSize -> Full, AspectRatio -> 1, MeshFunctions -> {f'},
  Mesh -> {{0}}, MeshShading -> {Red, Blue},
  PlotLabel -> Row[{"f(x) = ", f[x]}]], {{nMax, 1, "Order"}, 1, 10, 1,
   PopupMenu}]
The colors of the first derivative function in the image obtained from the above code are different on and below the x-axis. The colors of the monotonically increasing and decreasing parts of the original function are different. But the colors between them are consistent and difficult to distinguish.
My requirements are:
The image of the first derivative function has different colors on the x-axis and is represented by two different colors. The colors of all images above and below the x-axis are the same.
The image of the original function is represented by two different colors in the monotonically increasing and monotonically decreasing parts, with the colors of the monotonically increasing and monotonically decreasing parts being the same.
Then the first derivative function and the original function use two different colors.
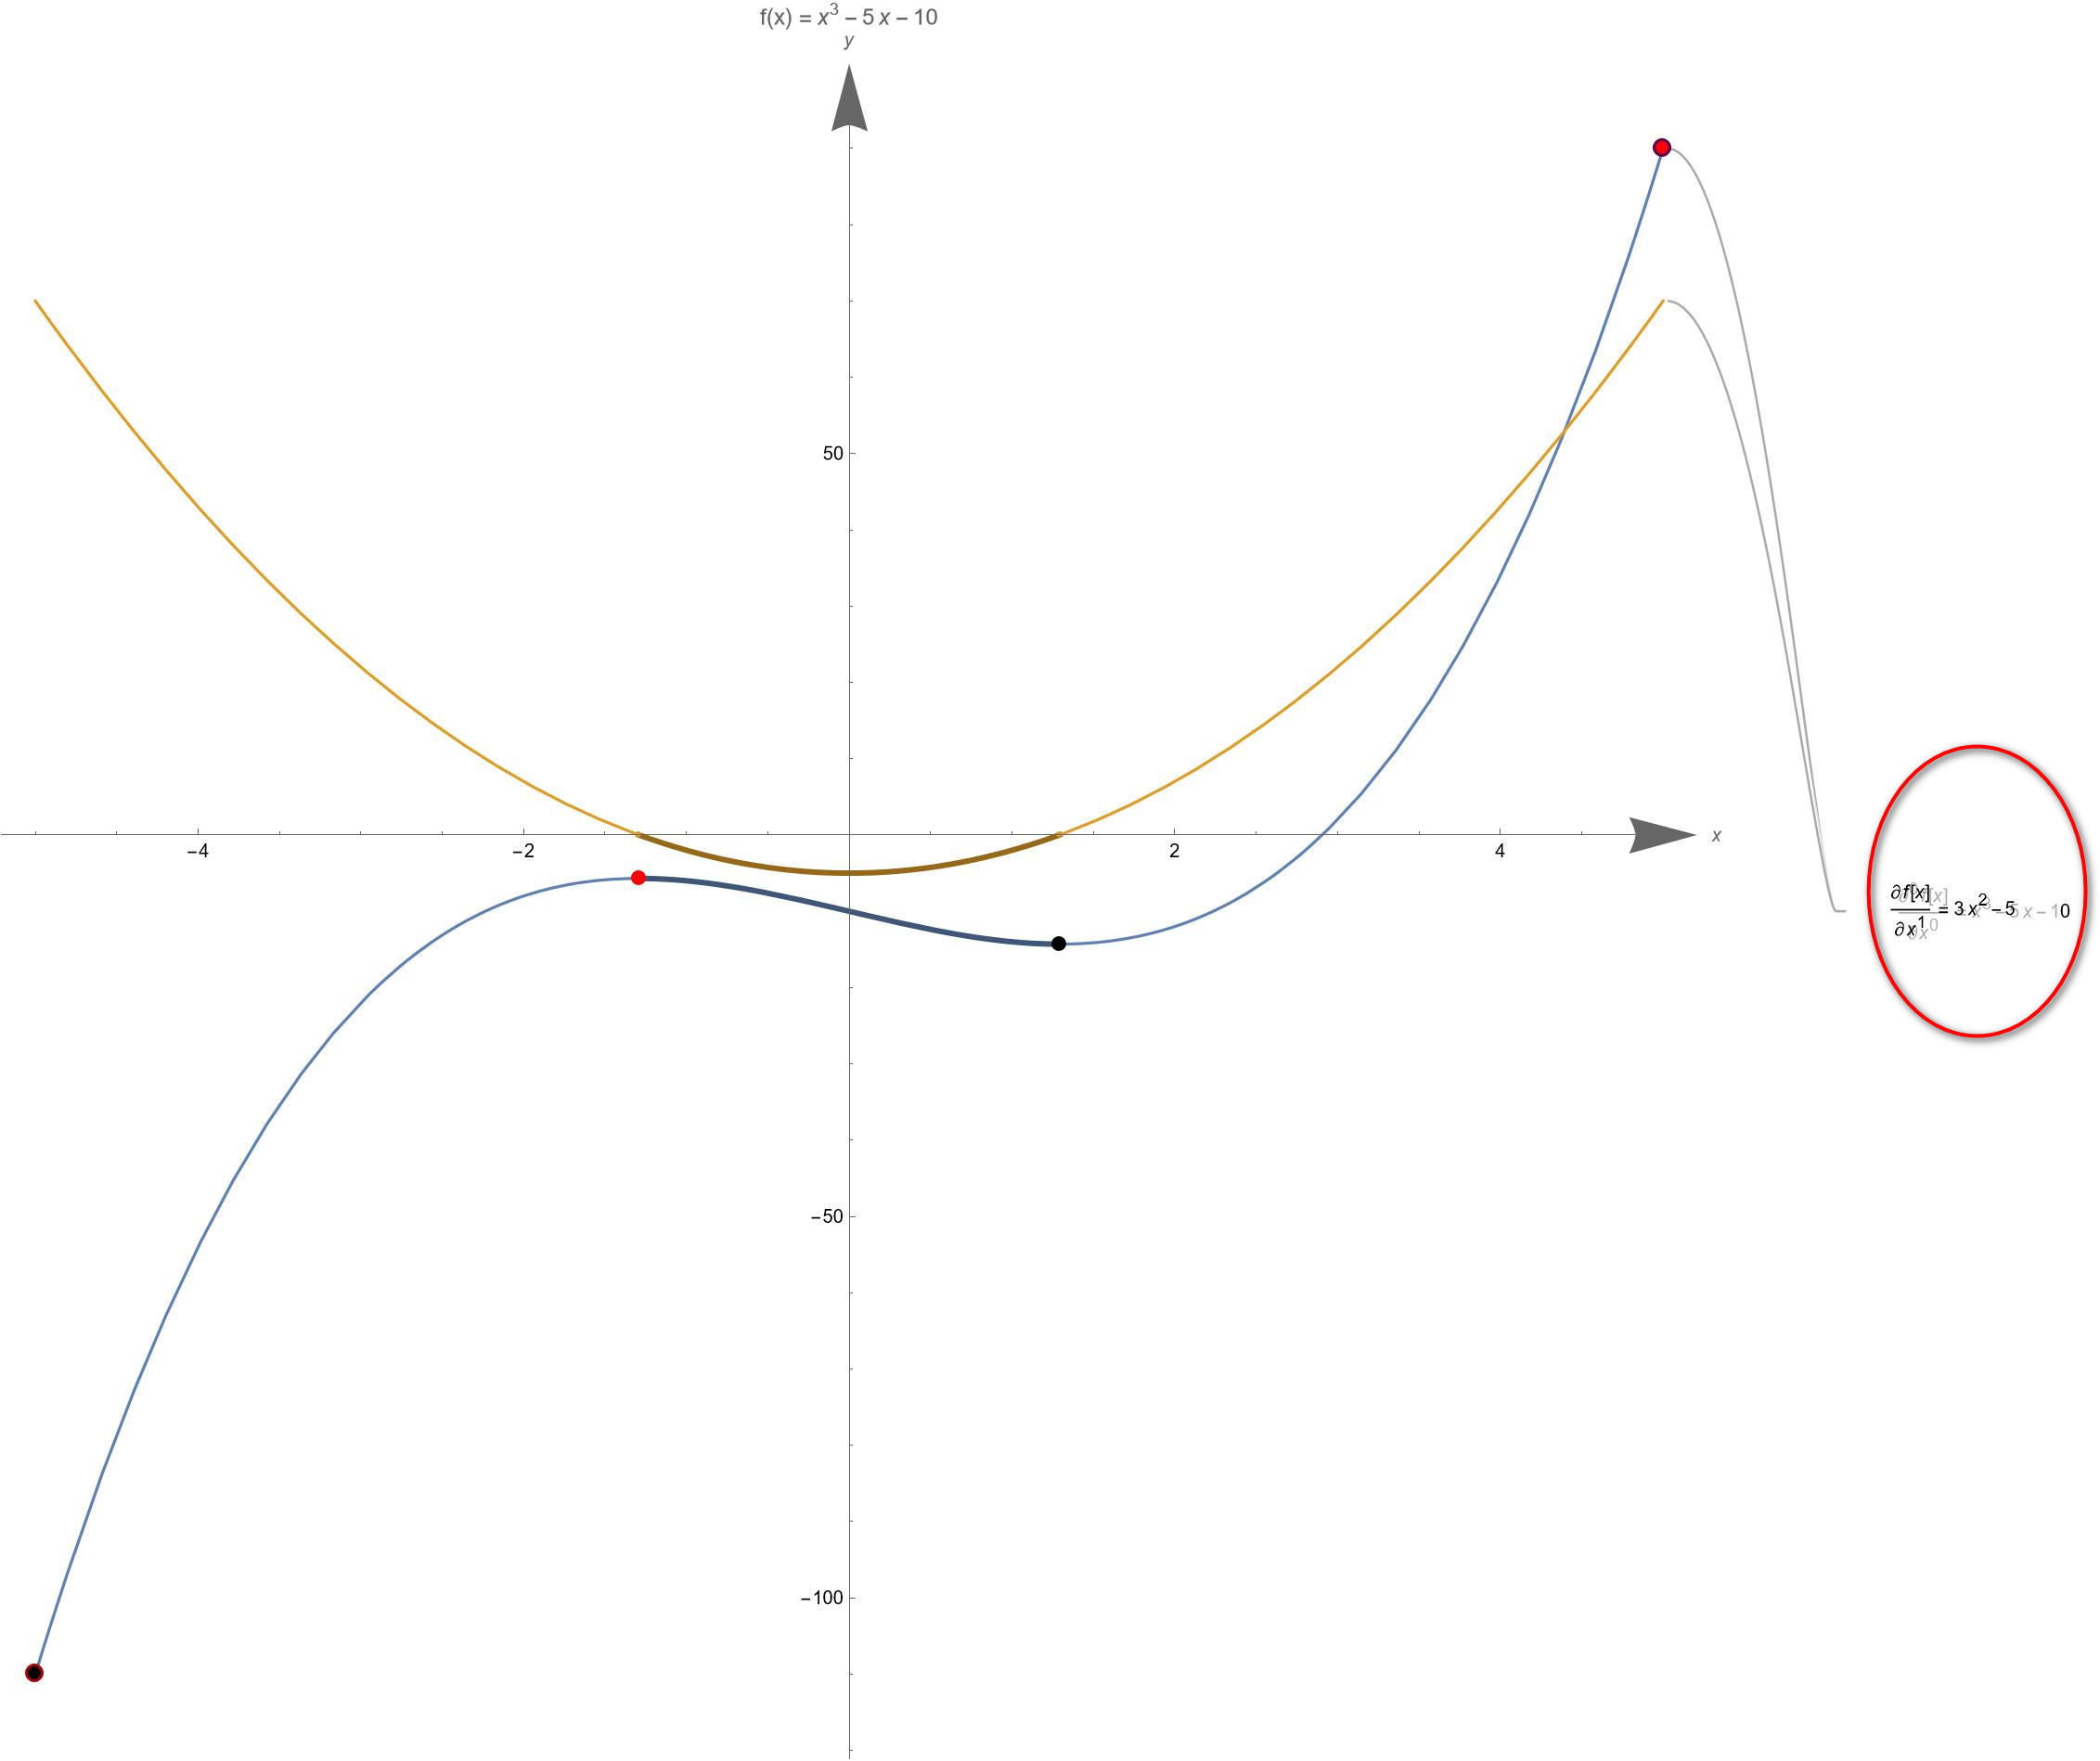
Update 1: based on kglr
ClearAll["`*"];
f[x_] := x^3 - 5 x - 10
D[f[x], x] // FullSimplify
xr = -5 <= x <= 5
Solve[D[f[x], x] == 0, x, Reals]
NSolve[D[f[x], x] == 0 && xr, x, Reals]
gmax = Maximize[{f[x], xr}, x]
gmin = Minimize[{f[x], xr}, x]
lmax = Solve[{D[f[x], x] == 0, D[f[x], {x, 2}] < 0, xr}, x]
lmaxv = {x, f[x]} /. lmax[[1]] // FullSimplify
lmin = Solve[{D[f[x], x] == 0, D[f[x], {x, 2}] > 0, xr}, x]
lminv = {x, f[x]} /. lmin[[1]] // FullSimplify
Manipulate[
 Refresh[functions =
   Table[D[f[x], {x, n}], {n, 0, nMax, 1}] // FullSimplify;
  orders =
   Table[D[f[x], {x, n}] // Inactivate // TraditionalForm //
     ToString, {n, 0, nMax, 1}];
  labels =
   MapThread[#1 <> " = " <> ToString[#2, TraditionalForm] &, {orders,
     functions}];];
 Plot[{functions}, {x, -5, 5},
  Epilog -> {{Darker@Purple, AbsolutePointSize[10],
     Point[{x, f[x]} /. gmax[[2]]], AbsolutePointSize[7], Red,
     Point[{x, f[x]} /. gmax[[2]]]}, {Darker@Red,
     AbsolutePointSize[10], Point[{x, f[x]} /. gmin[[2]]],
     AbsolutePointSize[7], Black, Point[{x, f[x]} /. gmin[[2]]]},
    AbsolutePointSize[8], Black, Point[{x, f[x]} /. lmin], Red,
    Point[{x, f[x]} /. lmax]}, PlotLabels -> labels,
  AxesStyle -> Arrowheads[{0.0, 0.04}], AxesLabel -> {x, y},
  ImageSize -> Full, AspectRatio -> 1, MeshFunctions -> {f'},
  Mesh -> {{0}},
  MeshShading -> {Dynamic[
     Directive[Darker[CurrentValue["Color"]], AbsoluteThickness[3]]],
    Automatic},
  PlotLabel -> Row[{"f(x) = ", f[x]}]], {{nMax, 1, "Order"}, 1, 10, 1,
   PopupMenu}]
Why do the labels of the functions overlap after running?


