1
$\begingroup$
Clear["Global`*"]

pts = {{1, 0}, {2, -1 + 2/E}, {3, -1 + 3/E^2}, {4, -1 + 4/E^3}};

p[x_] = a (x^3) + b (x^2) + c (x) + d;

print["p[x]=", p[x]];

eq1 = p[1] == 0;

eq2 = p[2] == -1 + 2/E;

eq3 = p[3] == -1 + 3/E^2;

eq4 = p[4] == -1 + 4/E^3;

eqns = {eq1, eq2, eq3, eq4};

vars = {a, b, c, d};

solset = Solve[eqns, vars];

Print[TableForm[eqns]];

Print["Solve and get"];

Print[solset];

p[x];

ReplaceAll[p[x],solset[[1]]]; (*Note this is solset subscript [[1]] but I didnt know how to write it onto here*)

p3[x_]=ReplaceAll[p[x],solset[[1]]];(*Note this is solset subscript [[1]] but I didnt know how to write it onto here, it is also p subscript 3*)

Needs["Graphics`Colors`"];

dots = ListPlot[pts, PlotStyle -> {Red, 
PointSize[0.02]}, 

 DisplayFunction -> Identity]
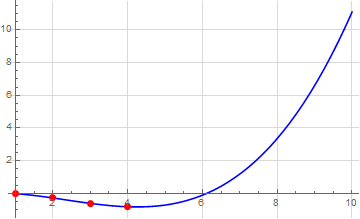
gr = Plot[[p3][x], {x, 1.0, 10.0}, PlotStyle -> Blue, DisplayFunction -> Identity]; (Note it is also p subscript 3)

graph1 = Show[gr, dots, PlotRange -> {{0, 10}, {-10, 3}}, 
  Ticks -> {Range[0, 3, 1], Range[0, 3, 1]}, 
  DisplayFunction -> $DisplayFunction]

I am getting an error and the need function as well as there being an issue with posting my curve against the original functions curve. For now, I do see the curve plotted using the show function above but when I try to add the function before the beziur curve, it messes up.

$\endgroup$
4
  • $\begingroup$ [p3][x] is invalid syntax. Try p3[x]. $\endgroup$ Commented Oct 23, 2019 at 2:38
  • $\begingroup$ yes I changed that but I get two errors: 1.Get: Cannot open GraphicsColors. and 2. Needs:Context GraphicsColors was not created when Needs was evaluated. It only prints out my Beziur curve $\endgroup$ Commented Oct 23, 2019 at 3:05
  • $\begingroup$ There is no need to load GraphicsColors or specify DisplayFunction. $\endgroup$ Commented Oct 23, 2019 at 3:08
  • $\begingroup$ took them out! I tried adding p[x] to my gr then showing that graph which just gave me what I already had. I then tried to put p[x] next to gr like this {p[x],gr,....} and got the error: graphs cant be combined $\endgroup$ Commented Oct 23, 2019 at 3:19

2 Answers 2

1
$\begingroup$

You could try

Clear["Global`*"]

pts = {{1, 0}, {2, -1 + 2/E}, {3, -1 + 3/E^2}, {4, -1 + 4/E^3}};
p[x_] := a (x^3) + b (x^2) + c (x) + d;
eq1 = p[1] == 0;
eq2 = p[2] == -1 + 2/E;
eq3 = p[3] == -1 + 3/E^2;
eq4 = p[4] == -1 + 4/E^3;
eqns = {eq1, eq2, eq3, eq4};
vars = {a, b, c, d};
solset = Solve[eqns, vars];
dots = ListPlot[pts, PlotStyle -> {Red, PointSize[0.02]}];
gr = Plot[p[x] /. solset, {x, 1.0, 10.0}, PlotStyle -> Blue];
graph1 = Show[gr, dots, GridLines -> Automatic, GridLinesStyle -> LightGray]

Mathematica graphics

Are you using very old version of Mathematica? Because you using very old commands there. The above is done on 11.3.

Also notice that show takes default options from the first graphics in its input. If you want the options taken from the second plot, you can change the order, or provide explicit options in Show itself

$\endgroup$
0
$\begingroup$
Clear["Global`*"]

pts = {{1, 0}, {2, -1 + 2/E}, {3, -1 + 3/E^2}, {4, -1 + 4/E^3}};

p[x_] = a (x^3) + b (x^2) + c (x) + d;

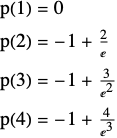
Note that Print is seldom required

Column[StringForm["p(`1`) = `2`", ##] & @@@ pts] // TraditionalForm

enter image description here

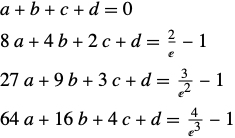
(eqns = p[#[[1]]] == #[[2]] & /@ pts) // Column // TraditionalForm

enter image description here

vars = Variables[Level[eqns, {-1}]];

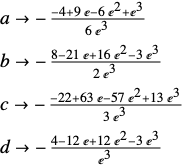
Solve and get

(solset = Solve[eqns, vars][[1]]) // Column // TraditionalForm

enter image description here

Verifying the solution,

And @@ (eqns /. solset)

(* True *)

StringForm["p(x) = ``", p[x] /. solset] // TraditionalForm

enter image description here

or

StringForm["p(x) = ``", p[x] /. solset // Simplify] // TraditionalForm

enter image description here

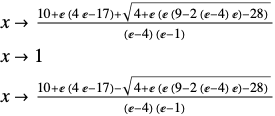
The exact roots of p[x] are

(roots = Solve[p[x] == 0 /. solset, x] // SortBy[#, N] & // 
     FullSimplify) // Grid[#, Alignment -> Left] & // TraditionalForm

enter image description here

The approximate numeric values of the roots are

roots // N // Grid[#, Alignment -> Left] &

enter image description here

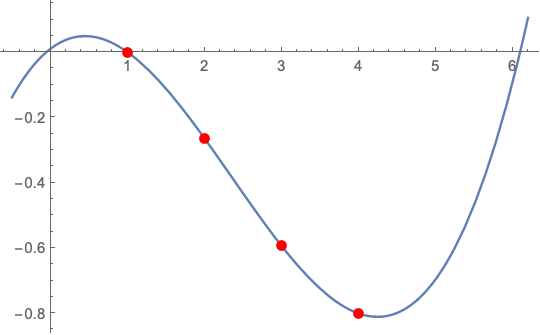
Plot[p[x] /. solset, {x, -0.5, 6.2},
 Epilog -> {Red, PointSize[0.02], Point[pts]}]

enter image description here

$\endgroup$

Your Answer

By clicking “Post Your Answer”, you agree to our terms of service and acknowledge you have read our privacy policy.

Not the answer you're looking for? Browse other questions tagged or ask your own question.