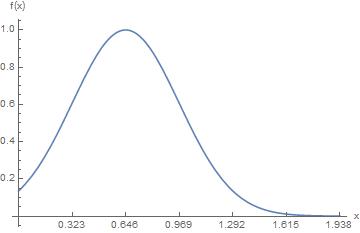
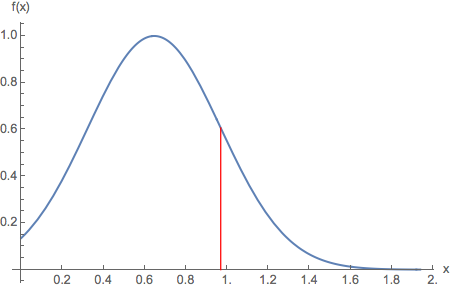
Say I have some plot, such as:
Plot[Exp[-(x - 2)^2/(2*1^2)], {x, 0, 6}, AxesLabel -> {"x", "f(x)"}]
But I want to present it with the axis labeled as some scalar of a constant amount.
Suppose x represents a physical quantity (e.g. distance) and X=3.1 meters is a fundamental distance in this problem.
How can I change the axes in the plot so that the labels represent the value "x" in terms of "X"?
In other words, I would like for the plot to remain the same, but the previous location of the "1" tick would become ~0.323 (since 0.323*3.1 ~ 1), or a new "1" tick would appear slightly past the original location of the "3" tick.
How can I accomplish this (without changing the plot itself, only the axes representation).


xin your function instead. So, doPlot[Exp[-(3.1*x - 2)^2/(2*1^2)], {x, 0, 6/3.1}]. $\endgroup$