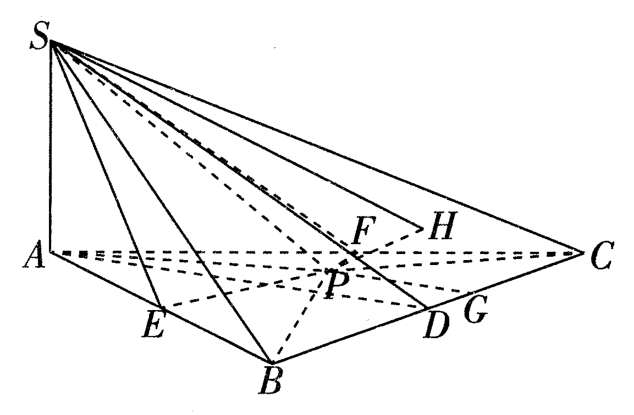
The base of triangular prism S-ABC is a regular triangle with side length of 2, SA is perpendicular to plane ABC, P is a moving point (including the boundary) inside triangle ABC. If SA = 1, the angles formed by SP and sides SAB, SAC, and SBC are a1, a2, and a3, respectively, and the distances from point P to AB, AC, and BC are d1, d2, and d3
How to draw a dynamic graph that can represent d1+d2+d3 as fixed values?
Clear["Global`*"];
a = {0, 0, 0};
b = {Sqrt[3], 1, 0};
c = {0, 2, 0};
s = {0, 0, 1};
labels = {Text[Style[A, 12, FontFamily -> "Times"], a, {1, 1}],
   Text[Style[B, 12, FontFamily -> "Times"], b, {1, 1}],
   Text[Style[C, 12, FontFamily -> "Times"], c, {1, 1}],
   Text[Style[S, 12, FontFamily -> "Times"], s, {2, -1}]};
dashLines = {Dashed, AbsoluteThickness[2], {Black, Line[{{a, c}}]}};
realLines = {AbsoluteThickness[2],
   Line[{{s, a}, {s, c}, {b, s}, {b, a}, {b, c}}]};
Show[Graphics3D[{dashLines, realLines, labels}, Boxed -> False,
  ViewPoint -> {2, 3, 2}],
 Graphics3D[{Arrow[{{s, s + {0, 0, 1}}, {a, a + {2, 0, 0}}, {c,
      c + {0, 1, 0}}}],
   Text[Style["z", Red, 20, Italic, FontFamily -> "Times"],
    s + {0, 0, 2}, {-1, -1}],
   Text[Style["y", Red, 20, Italic, FontFamily -> "Times"],
    c + {0, 1, 0}, {-2, -1}],
   Text[Style["x", Red, 20, Italic, FontFamily -> "Times"],
    a + {1, 0, 0}, {2, -1}]}]]

