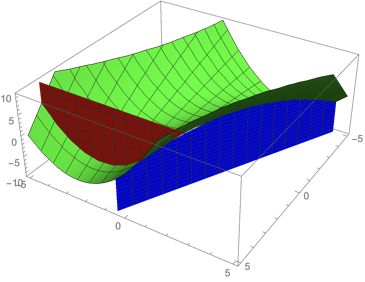
Suppose I want to plot 3 surfaces, z=xy+y^2, x=4 & x+2y=4 together so that x=4 plane will be in the upper region of z=xy+y^2 surface and x+2y=4 plane will be in the lower region of z=xy+y^2 surface.How to make this plot in the region where x & y varies from 0 to 5 and z varies from 0 to 10 ?
1 Answer
$\begingroup$
$\endgroup$
1
aaa = Plot3D[x y + y^2,
  {x, -5, 5}, {y, -5, 5},
  PlotRange -> {-10, 10},
  PlotStyle -> Green,
  ClippingStyle -> None];

bbb = ParametricPlot3D[{4, y, z},
  {y, -5, 5}, {z, 4 y + y^2, 10},
  PlotStyle -> Red];

ccc = ParametricPlot3D[{x, (4 - x)/2, z},
  {x, -5, 5}, {z, -10, x (4 - x)/2 + ((4 - x)/2)^2},
  PlotStyle -> Blue];

Show[aaa,bbb,ccc]

