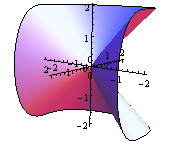
I see ContourPlot3D doesn't show the X, Y, Z axis by default (i mean inside the graph), i tried adding ",Axis->True" to the call, but doesn't make effect.
How to do this?
ContourPlot3D[
 x^3 + y^2 - z^2 == 0, {x, -2, 2}, {y, -2, 2}, {z, -2, 2},
 Boxed -> False, AxesOrigin -> {0, 0, 0}, Mesh -> None]

ContourPlot3D[ x^3 + y^2 - z^2 == 0, {x, -2, 2}, {y, -2, 2}, {z, -2, 2}, Boxed -> False, AxesOrigin -> {0, 0, 0}, Mesh -> None, AxesLabel -> {x, y, z}, LabelStyle -> Directive[20, Bold]]
$\endgroup$
Commented
May 21, 2014 at 21:50
Boxed -> False... the axes are there by default $\endgroup$