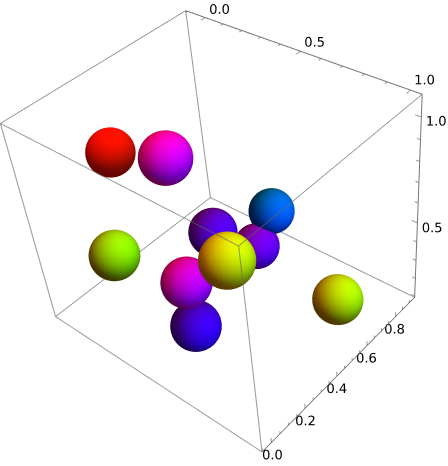
Update:
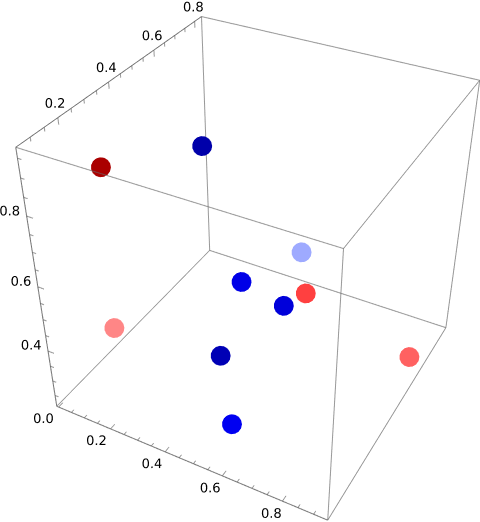
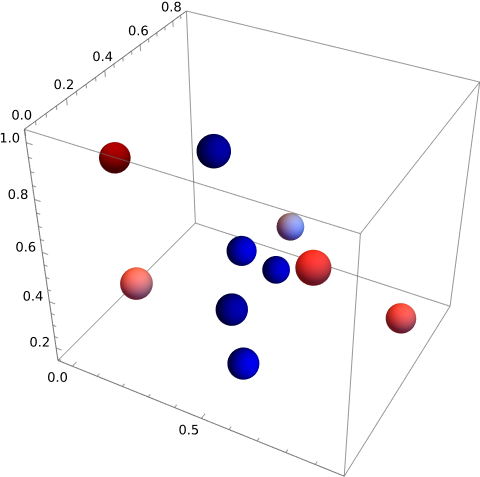
"i want the largest positive to be dark blue, small positive to be light blue, small negative to be light red and large negative to be dark red"
SeedRandom[1];
ixyzc = MapIndexed[Flatten@*Reverse@*List]@RandomReal[1, {10, 4}];
Change the last column of input data so that it runs from -1 to 1:
ixyzc2 = MapAt[Rescale[#, MinMax@ixyzc[[All, -1]], {-1, 1}] &,
   ixyzc, {All, -1}];
Use the last column of input data to specify colors running thru the color list {Darker@Red, Red, LightRed, White, LightBlue, Blue, Darker@Blue} as the value of last column runs from -1 to 1:
styleddata2 = Style[{#2, #3, #4}, Blend[
 Thread[{Subdivide[-1, 1, 6],
   {Darker@Red, Red, LightRed, White, LightBlue, Blue, Darker@Blue}}], #5]]& @@@
  ixyzc2;


ListPointPlot3D[styleddata2, BoxRatios -> 1,
 BaseStyle -> AbsolutePointSize[15]]
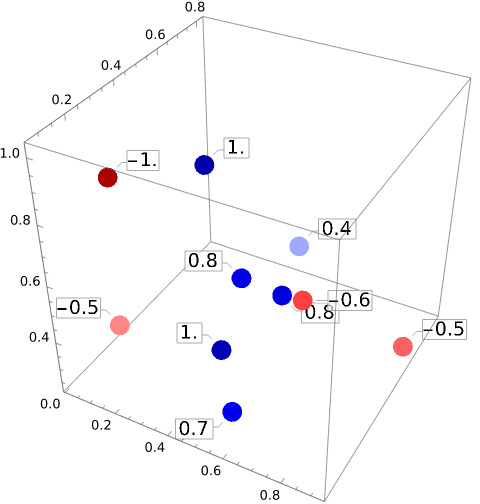
Attach last column values as labels to verify that colors and values match as desired:
styledlabeleddata2 = MapThread[
  Callout[#, Round[#2, .1], LabelStyle -> 14, Appearance -> "Frame"] &]@
  {styleddata2, ixyzc2[[All, -1]]};

ListPointPlot3D[styledlabeleddata2,
 BoxRatios -> 1, BaseStyle -> AbsolutePointSize[15]]
Graphics3D[styleddata2 /. Style[a_, b_] :> {b, Sphere[a, .05]},
 Axes -> True]
Original answer:
SeedRandom[1];
ixyzc = MapIndexed[Flatten@*Reverse@*List]@RandomReal[1, {10, 4}]
{{1, 0.817389, 0.11142, 0.789526, 0.187803},
 {2, 0.241361, 0.0657388, 0.542247, 0.231155},
 {3, 0.396006, 0.700474, 0.211826, 0.748657},
 {4, 0.422851, 0.247495, 0.977172, 0.825163},
 {5, 0.925275, 0.578056, 0.29287, 0.208051},
 {6, 0.580474, 0.128821, 0.306427, 0.712012},
 {7, 0.390582, 0.819967, 0.325351, 0.59326},
 {8, 0.518774, 0.169013, 0.472565, 0.807161},
 {9, 0.0118355, 0.316876, 0.789804, 0.011978},
 {10, 0.391276, 0.458902, 0.458845, 0.727517}}
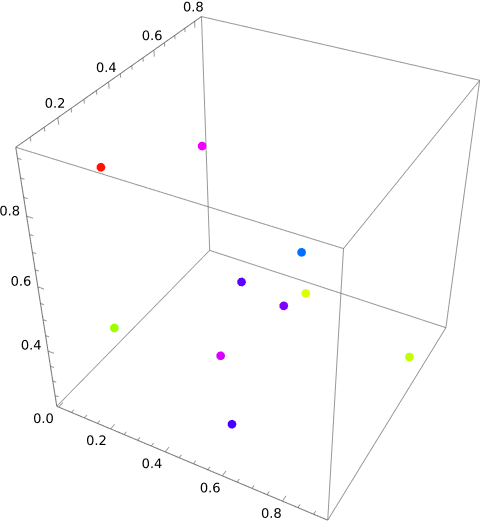
styleddata = Style[{#2, #3, #4}, Hue@#5] & @@@ ixyzc;


ListPointPlot3D[styleddata, BoxRatios -> 1]
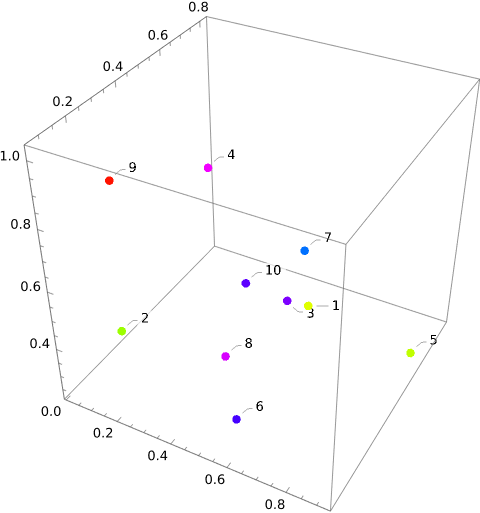
If you want to add labels:
styledlabeleddata =  Callout[Style[{#2, #3, #4}, Hue@#5], #] & @@@ ixyzc;


ListPointPlot3D[styledlabeleddata, BoxRatios -> 1]
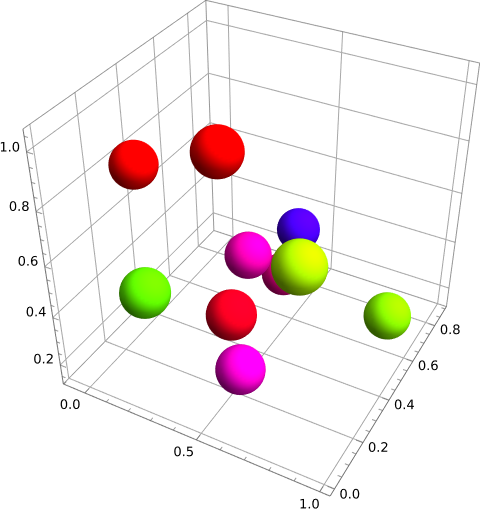
labeleddata = Association[# -> {##2} & @@@ ixyzc];

BubbleChart3D[labeleddata,
 ColorFunction -> (Hue@#4 &),
 BubbleSizes -> {.1, .1}]
BubbleChart3D[labeleddata, ColorFunction -> (Hue@#4 &),
 BubbleSizes -> {.1, .1}, ChartLabels -> Automatic,  LabelStyle -> 16]
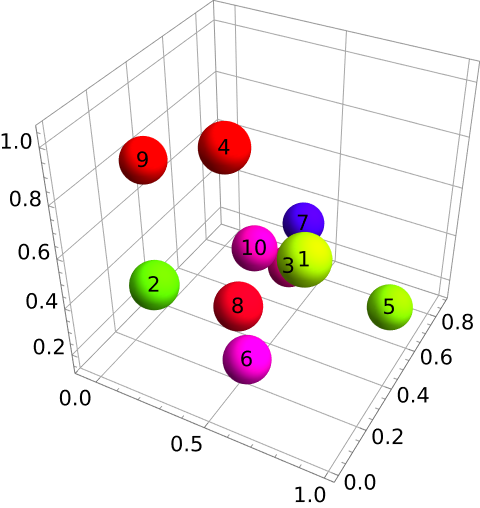
g3ddata = {Hue@#5, Sphere[{#2, #3, #4}, .1]} & @@@ ixyzc;

Graphics3D[g3ddata, Axes -> True]
