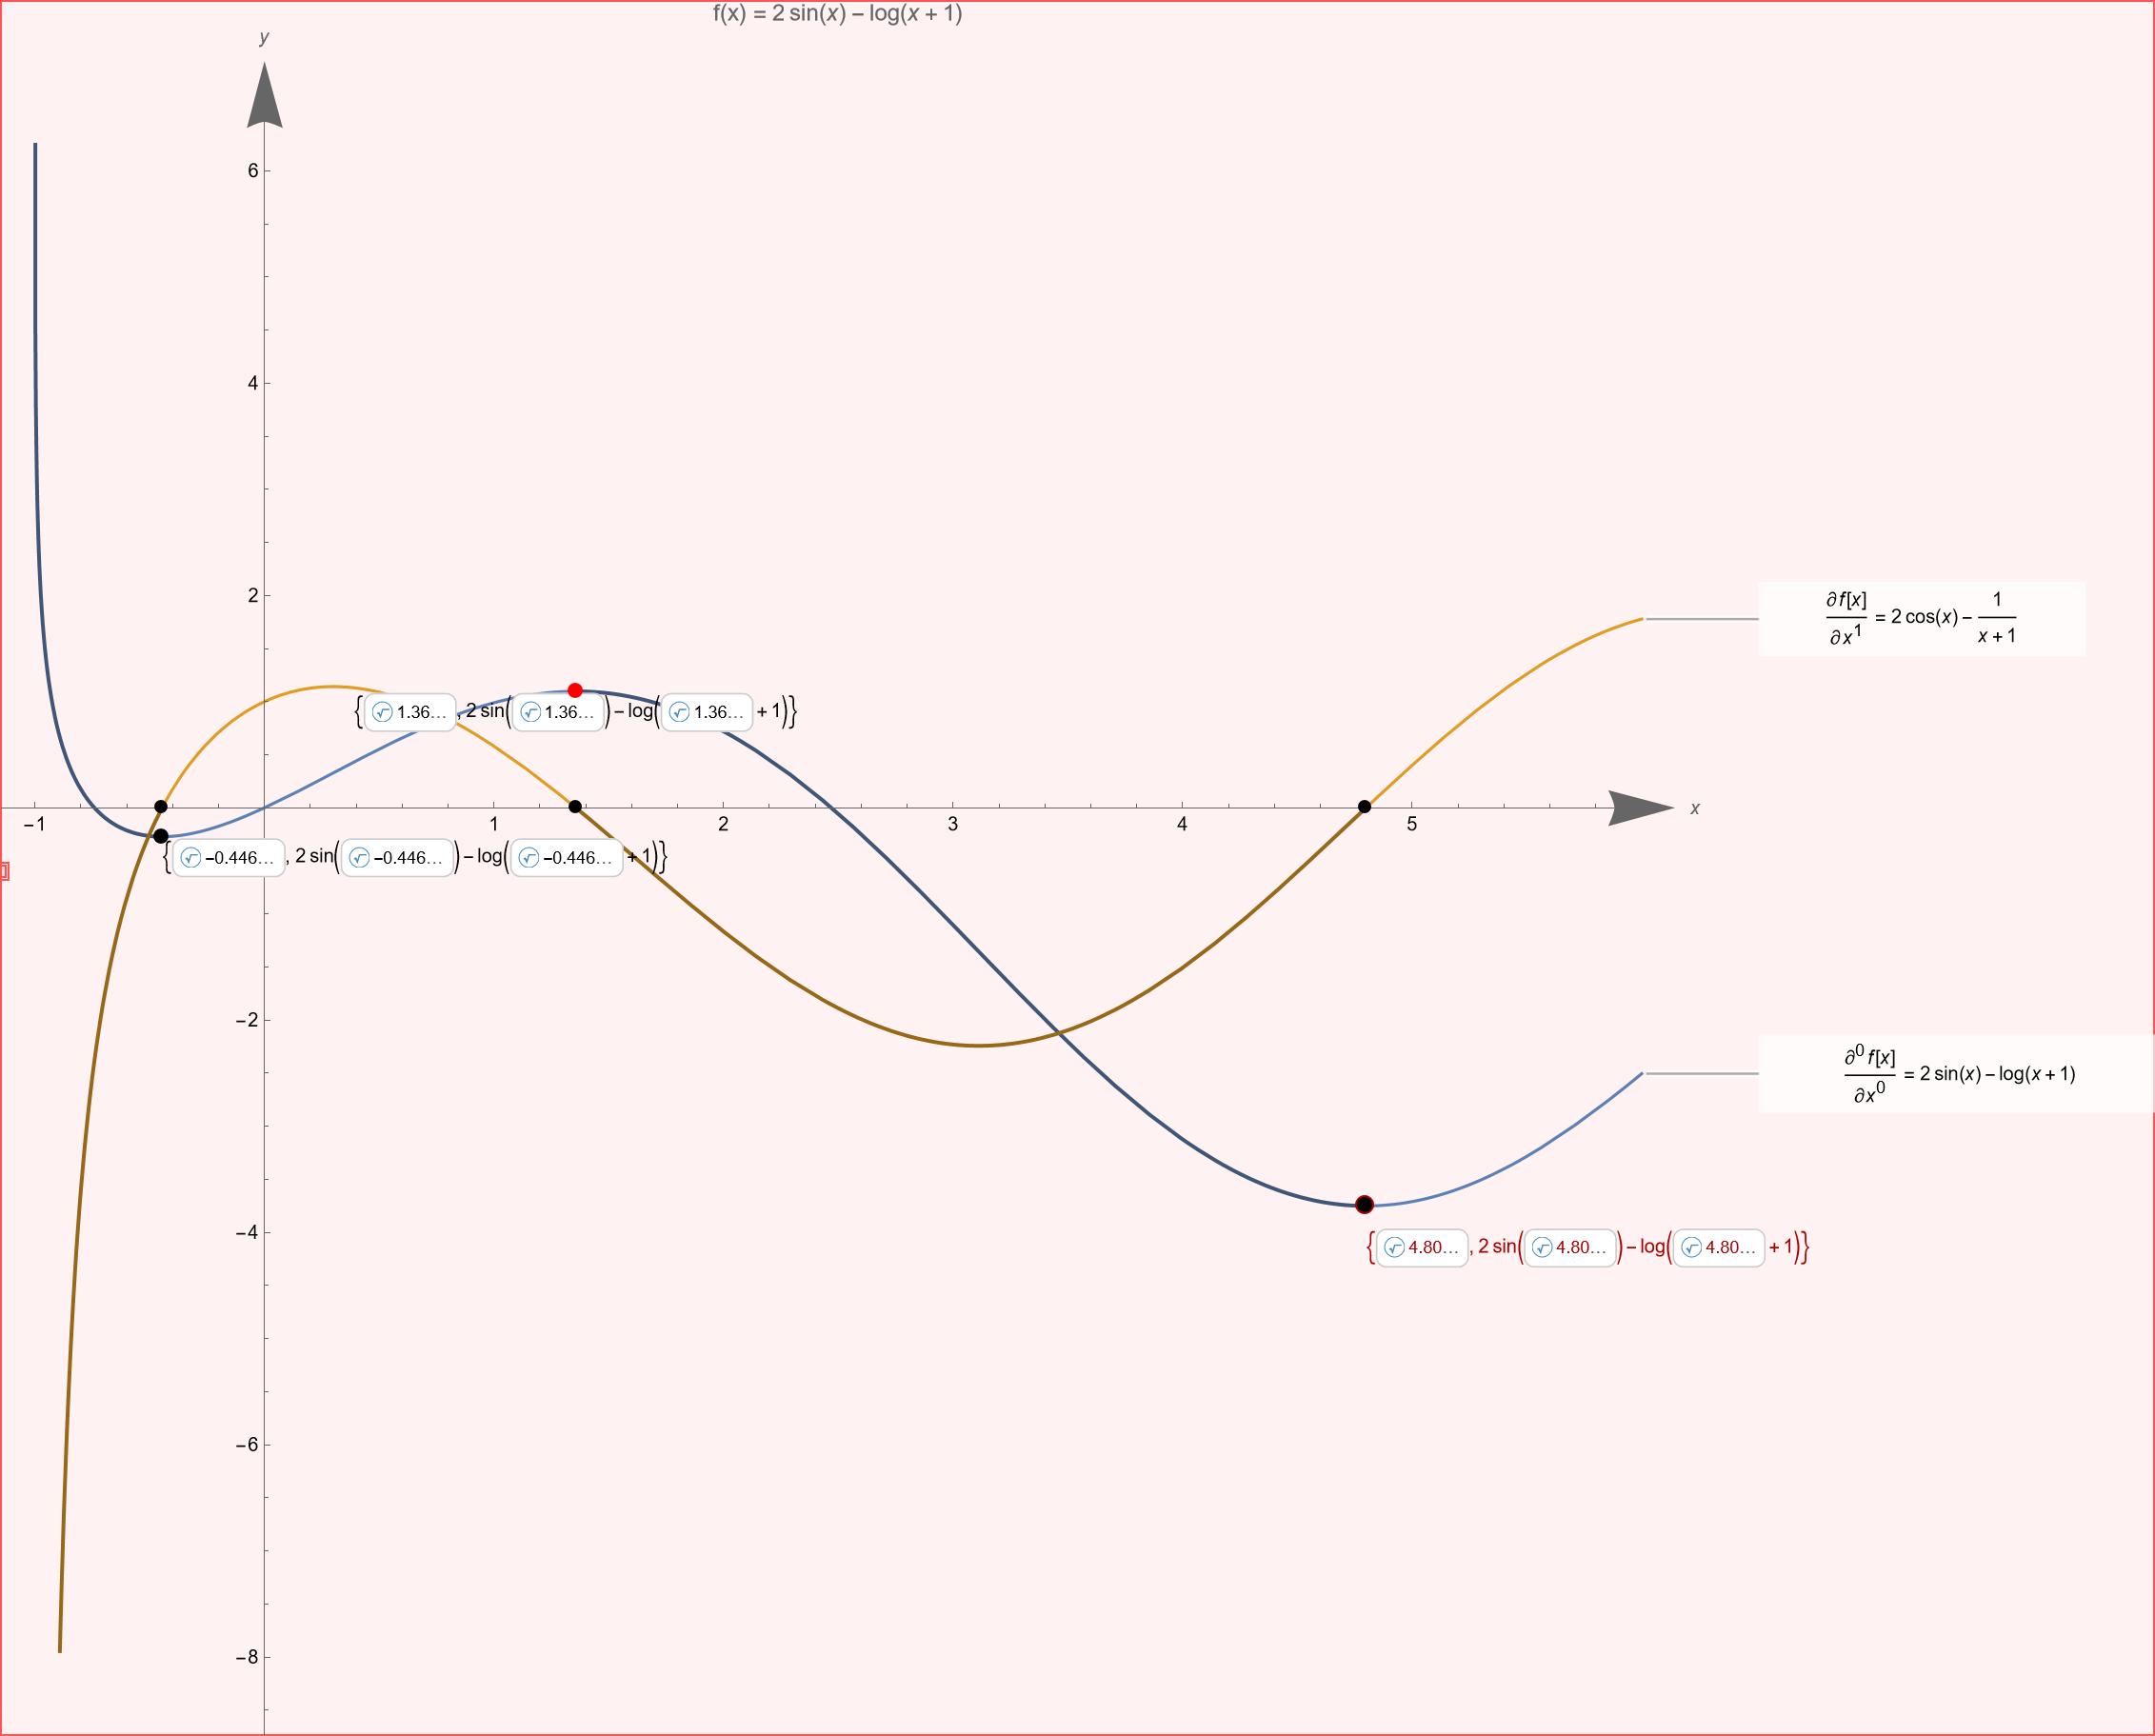
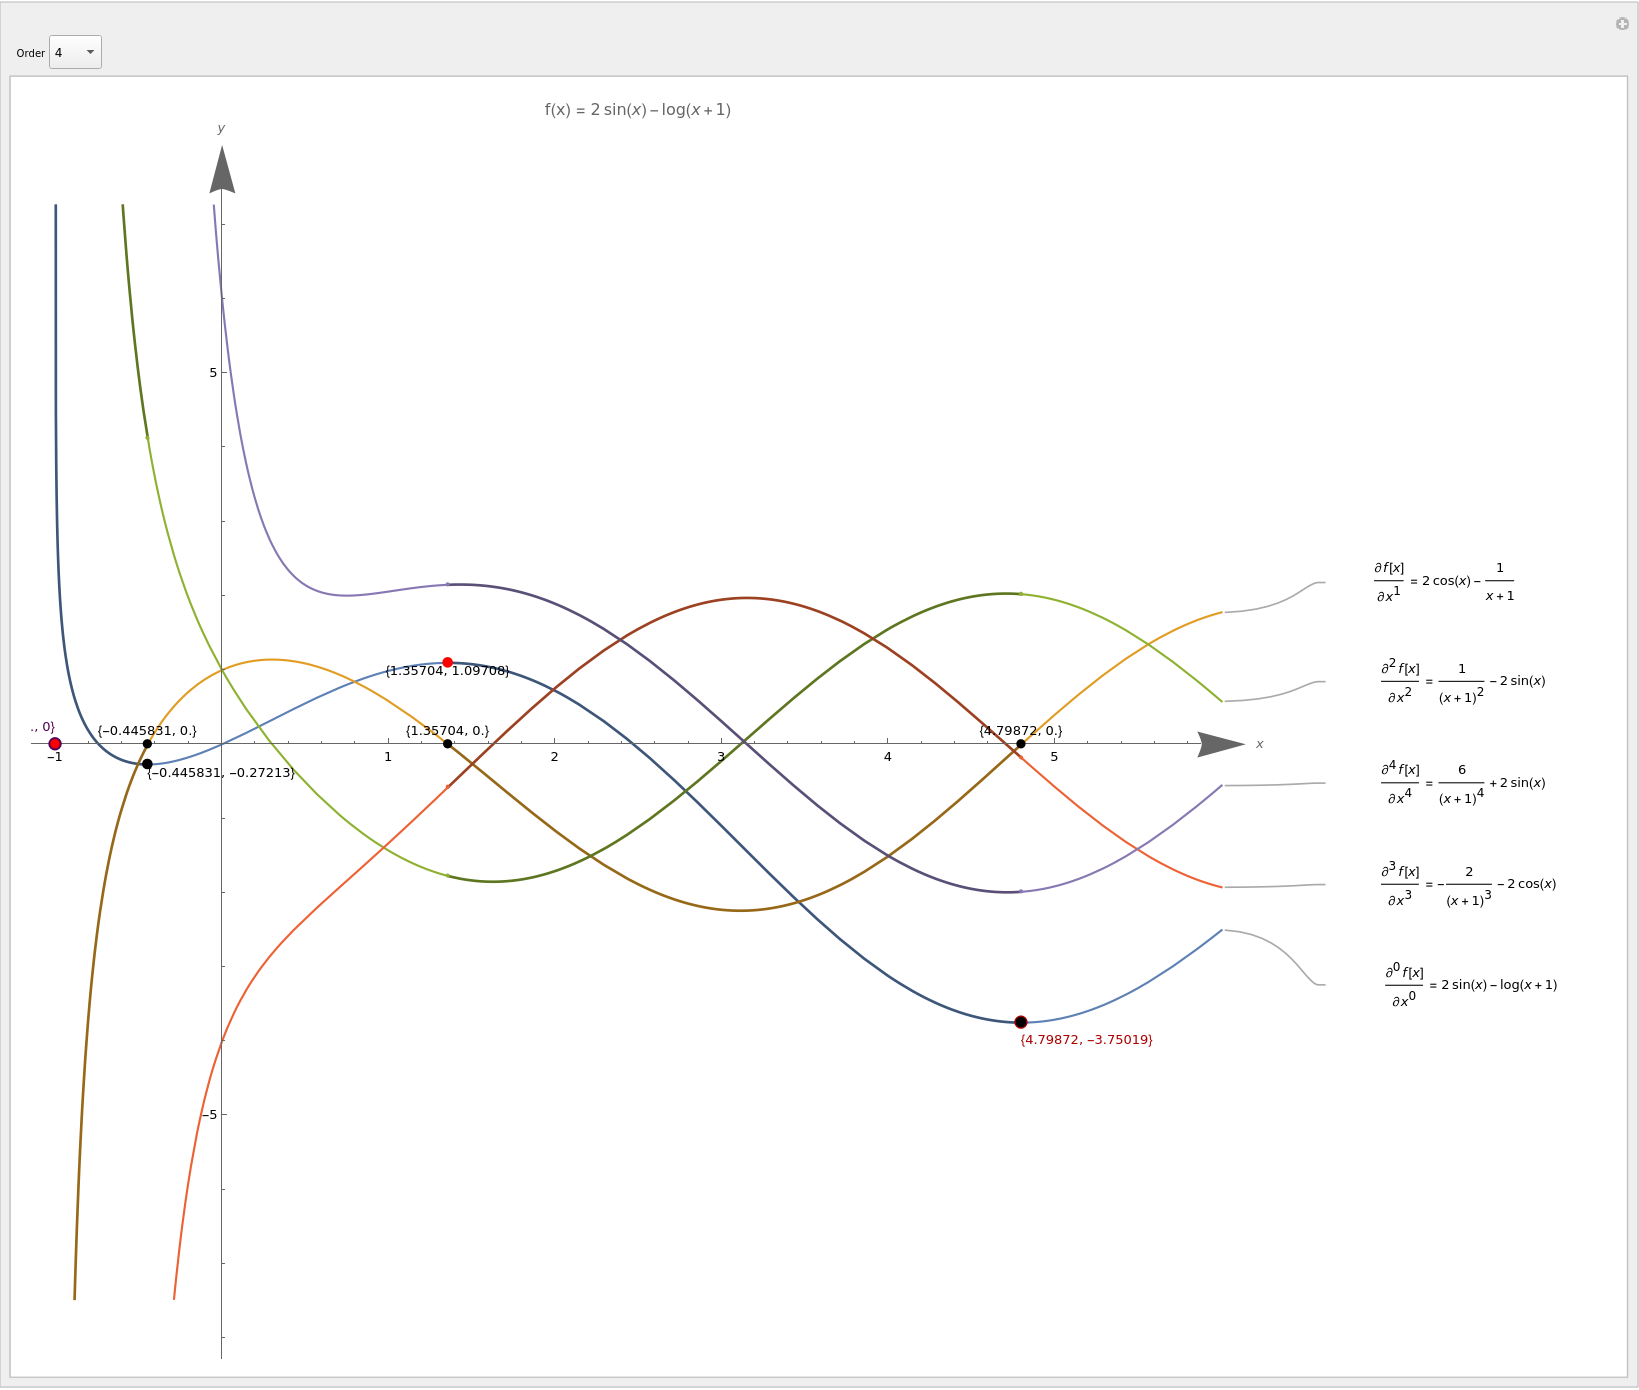
You have posted almost identical question and got several answers: How can I mark the intersection of lines and curves with letters and coordinate values?. I am certain that given the complexity of code you use (and 110 questions on this site) that you are able to modify one of those answers such that the label appears on the x-axis. – Domen
How can I mark the intersection of lines and curves with letters and coordinate values?
I personally think there is a significant difference between my question this time and the one I asked last time. The number of intersections between the ellipse and the line in the previous problem was determined.
The question I am asking this time is about the labeling of the intersection point of the first derivative of any function with the x-axis in the Domain of a function of the original function. And label the corresponding coordinate values next to the intersection points of the image. The number of zeros is uncertain.
I personally added a loop structure to solve this problem, but it did not solve the problem
{PointSize[Large], Black, Point[zps],
 Do[Text[zps[[s]], zps[[s]]], {s, 1, Length[zps], 1}]}
ClearAll["`*"];
f[x_] := 2 Sin[x] - Log[x + 1]
D[f[x], x] // FullSimplify
xr = -1 < x <= 5
Solve[D[f[x], x] == 0, x, Reals]
sol = Solve[D[f[x], x] == 0 && xr, x, Reals]
zps = {x, 0} /. sol
Reduce[D[f[x], x] > 0 && xr, x, Reals]
Reduce[D[f[x], x] < 0 && xr, x, Reals]
gmax = Maximize[{f[x], xr}, x]
gmin = Minimize[{f[x], xr}, x]
lmax = Solve[{D[f[x], x] == 0, D[f[x], {x, 2}] < 0, xr}, x]
lmaxv = {x, f[x]} /. lmax[[1]] // FullSimplify
lmin = Solve[{D[f[x], x] == 0, D[f[x], {x, 2}] > 0, xr}, x]
lminv = {x, f[x]} /. lmin[[1]] // FullSimplify
Manipulate[
 Refresh[functions =
   Table[D[f[x], {x, n}], {n, 0, nMax, 1}] // FullSimplify;
  orders =
   Table[D[f[x], {x, n}] // Inactivate // TraditionalForm //
     ToString, {n, 0, nMax, 1}];
  labels =
   MapThread[#1 <> " = " <> ToString[#2, TraditionalForm] &, {orders,
     functions}];];
 Plot[{functions}, {x, -1, 6},
  Epilog -> {{PointSize[Large], Black, Point[zps],
     Do[Text[zps[[s]], zps[[s]]], {s, 1, Length[zps], 1}]}, {Darker@
      Purple, AbsolutePointSize[10],
     Text[{x, f[x]} /. gmax[[2]], {x, f[x]} /. gmax[[2]], {1, -2}],
     Point[{x, f[x]} /. gmax[[2]]], AbsolutePointSize[7], Red,
     Point[{x, f[x]} /. gmax[[2]]]}, {Darker@Red,
     AbsolutePointSize[10],
     Text[{x, f[x]} /. gmin[[2]], {x, f[x]} /. gmin[[2]], {-1, 2}],
     Point[{x, f[x]} /. gmin[[2]]], AbsolutePointSize[7], Black,
     Point[{x, f[x]} /. gmin[[2]]]}, AbsolutePointSize[8],
    Text[ lminv, lminv, {-1, 1}], Black, Point[{x, f[x]} /. lmin],
    Text[ lmaxv, lmaxv, {0, 1}], , Red, Point[{x, f[x]} /. lmax]},
  PlotLabels -> labels, AxesStyle -> Arrowheads[{0.0, 0.04}],
  AxesLabel -> {x, y}, ImageSize -> Full, AspectRatio -> 1,
  MeshFunctions -> {f'}, Mesh -> {{0}},
  MeshShading -> {Dynamic[
     Directive[Darker[CurrentValue["Color"]], AbsoluteThickness[2]]],
    Automatic},
  PlotLabel -> Row[{"f(x) = ", f[x]}]], {{nMax, 1, "Order"}, 1, 10, 1,
   PopupMenu}]
Input any function whose derivative has an uncertain number of zeros, which can be three, four, or more,like this:
According to the reply from kglr, the code has been updated:
ClearAll["`*"];
f[x_] := Sin[2 x] - 2 Sin[x]
D[f[x], x] // FullSimplify
xr = -5 <= x <= 5
Solve[D[f[x], x] == 0, x, Reals]
sol = Solve[D[f[x], x] == 0 && xr, x, Reals]
zps = {x, 0} /. sol
Reduce[D[f[x], x] > 0 && xr, x, Reals]
Reduce[D[f[x], x] < 0 && xr, x, Reals]
gmax = Maximize[{f[x], xr}, x]
gmin = Minimize[{f[x], xr}, x]
lmax = Solve[{D[f[x], x] == 0, D[f[x], {x, 2}] < 0, xr}, x]
lmaxv = {x, f[x]} /. lmax[[1]] // FullSimplify
lmin = Solve[{D[f[x], x] == 0, D[f[x], {x, 2}] > 0, xr}, x]
lminv = {x, f[x]} /. lmin[[1]] // FullSimplify
Manipulate[
 Refresh[functions =
   Table[D[f[x], {x, n}], {n, 0, nMax, 1}] // FullSimplify;
  orders =
   Table[D[f[x], {x, n}] // Inactivate // TraditionalForm //
     ToString, {n, 0, nMax, 1}];
  labels =
   MapThread[#1 <> " = " <> ToString[#2, TraditionalForm] &, {orders,
     functions}];];
 Plot[{functions}, {x, -5, 5},
  Epilog ->
   ReplaceAll[\[Infinity] -> 0]@{{PointSize[Large], Black, Point[zps],
       Table[Text[zps[[s]], Offset[{0, 15}, zps[[s]]]], {s, 1,
        Length[zps], 1}]}, {Darker@Purple, AbsolutePointSize[10],
      Text[{x, f[x]} /. gmax[[2]], {x, f[x]} /. gmax[[2]], {1, -2}],
      Point[{x, f[x]} /. gmax[[2]]], AbsolutePointSize[7], Red,
      Point[{x, f[x]} /. gmax[[2]]]}, {Darker@Red,
      AbsolutePointSize[10],
      Text[{x, f[x]} /. gmin[[2]], {x, f[x]} /. gmin[[2]], {-1, -3}],
      Point[{x, f[x]} /. gmin[[2]]], AbsolutePointSize[7], Black,
      Point[{x, f[x]} /. gmin[[2]]]}, AbsolutePointSize[8],
     Text[lminv, lminv, {-1, -2}], Black, Point[{x, f[x]} /. lmin],
     Text[lmaxv, lmaxv, {0, 1}], , Red, Point[{x, f[x]} /. lmax]},
  PlotLabels -> labels, AxesStyle -> Arrowheads[{0.0, 0.04}],
  AxesLabel -> {x, y}, ImageSize -> Full, AspectRatio -> 1,
  MeshFunctions -> {f'}, Mesh -> {{0}},
  MeshShading -> {Dynamic[
     Directive[Darker[CurrentValue["Color"]], AbsoluteThickness[2]]],
    Automatic},
  PlotLabel -> Row[{"f(x) = ", f[x]}]], {{nMax, 1, "Order"}, 1, 10, 1,
   PopupMenu}]
UPDATE 2:
ClearAll["`*"];
f[x_] := x^3 - 5 x - 10
D[f[x], x] // FullSimplify
xr = -5 <= x <= 5
Solve[D[f[x], x] == 0, x, Reals]
sol = Solve[D[f[x], x] == 0 && xr, x, Reals]
zps = {x, 0} /. sol
Reduce[D[f[x], x] > 0 && xr, x, Reals]
Reduce[D[f[x], x] < 0 && xr, x, Reals]
gmax = Maximize[{f[x], xr}, x]
gmin = Minimize[{f[x], xr}, x]
lmax = Solve[{D[f[x], x] == 0, D[f[x], {x, 2}] < 0, xr}, x]
lmaxv = {x, f[x]} /. lmax[[1]] // FullSimplify
lmin = Solve[{D[f[x], x] == 0, D[f[x], {x, 2}] > 0, xr}, x]
lminv = {x, f[x]} /. lmin[[1]] // FullSimplify
Manipulate[
 Refresh[functions =
   Table[D[f[x], {x, n}], {n, 0, nMax, 1}] // FullSimplify;
  orders =
   Table[D[f[x], {x, n}] // Inactivate // TraditionalForm //
     ToString, {n, 0, nMax, 1}];
  labels =
   MapThread[#1 <> " = " <> ToString[#2, TraditionalForm] &, {orders,
     functions}];];
 Plot[{functions}, {x, -5, 5},
  Epilog ->
   ReplaceAll[\[Infinity] -> 0]@{{PointSize[Large], Black, Point[zps],
       Table[Text[zps[[s]], Offset[{0, 18}, zps[[s]]]], {s, 1,
        Length[zps], 1}]}, {Darker@Purple, AbsolutePointSize[10],
      Text[{x, f[x]} /. gmax[[2]], {x, f[x]} /. gmax[[2]], {1, -2}],
      Point[{x, f[x]} /. gmax[[2]]], AbsolutePointSize[7], Red,
      Point[{x, f[x]} /. gmax[[2]]]}, {Darker@Red,
      AbsolutePointSize[10],
      Text[{x, f[x]} /. gmin[[2]], {x, f[x]} /. gmin[[2]], {-1, -2}],
      Point[{x, f[x]} /. gmin[[2]]], AbsolutePointSize[7], Black,
      Point[{x, f[x]} /. gmin[[2]]]}, AbsolutePointSize[8],
     Text[lminv, lminv, {-1, 1}], Black, Point[{x, f[x]} /. lmin],
     Text[lmaxv, lmaxv, {0, 1}], , Red, Point[{x, f[x]} /. lmax]},
  PlotLabels -> labels, AxesStyle -> Arrowheads[{0.0, 0.04}],
  AxesLabel -> {x, y}, ImageSize -> Full, AspectRatio -> 1,
  MeshFunctions -> {f'}, Mesh -> {{0}},
  MeshShading -> {Dynamic[
     Directive[Darker[CurrentValue["Color"]], AbsoluteThickness[2]]],
    Automatic},
  PlotLabel -> Row[{"f(x) = ", f[x]}]], {{nMax, 1, "Order"}, 1, 10, 1,
   PopupMenu}]


