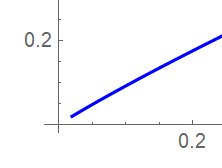
How to show the zero point of the crossing point between two axis ?
1 Answer
$\begingroup$
$\endgroup$
3
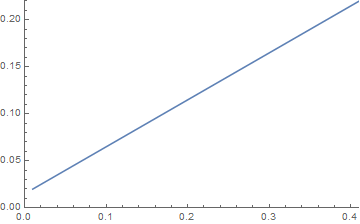
data = {{0.01, 0.02}, {0.21, 0.12}, {0.41, 0.22}};

plotrange = {0, Max[#]} & /@ Transpose[data];

plot = ListLinePlot[data, PlotRange -> plotrange]
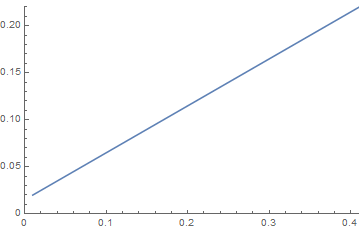
To change the zeros to "0" FindTicks can be used. This includes a replacement to increase the tick height to 0.007 because otherwise they shrink a bit. (No one knows why.)
ticks = Charting`FindTicks[{0, 1}, {0, 1}] @@@ plotrange /.
   {{0., 0} -> {0., "0"}, {0.005, 0.} -> {0.007, 0.}};

ListLinePlot[data, PlotRange -> plotrange, Ticks -> ticks]
-
-
$\begingroup$ No problem. BTW you could use
ListLinePlot[data, PlotRange -> {{0, Automatic}, {0, Automatic}}]$\endgroup$ Commented Apr 3, 2019 at 16:08 -


AxesOrigin -> {0, 0}to the options for your plot. $\endgroup$Ticksto add your own ticks on the axis. TryTicks->{Table[i,{0,0.3,0.1}],Table[i,{0,0.3,0.1}]}$\endgroup$(0, 0)but it's simply not displaying the 0 tick mark labels? $\endgroup$