2
$\begingroup$

I have two sets of points and need to construct a contour (for contour integration) that encloses all singularities given in points2 , but avoids enclosing singularities given points1, how should I implement this in Mathematica?

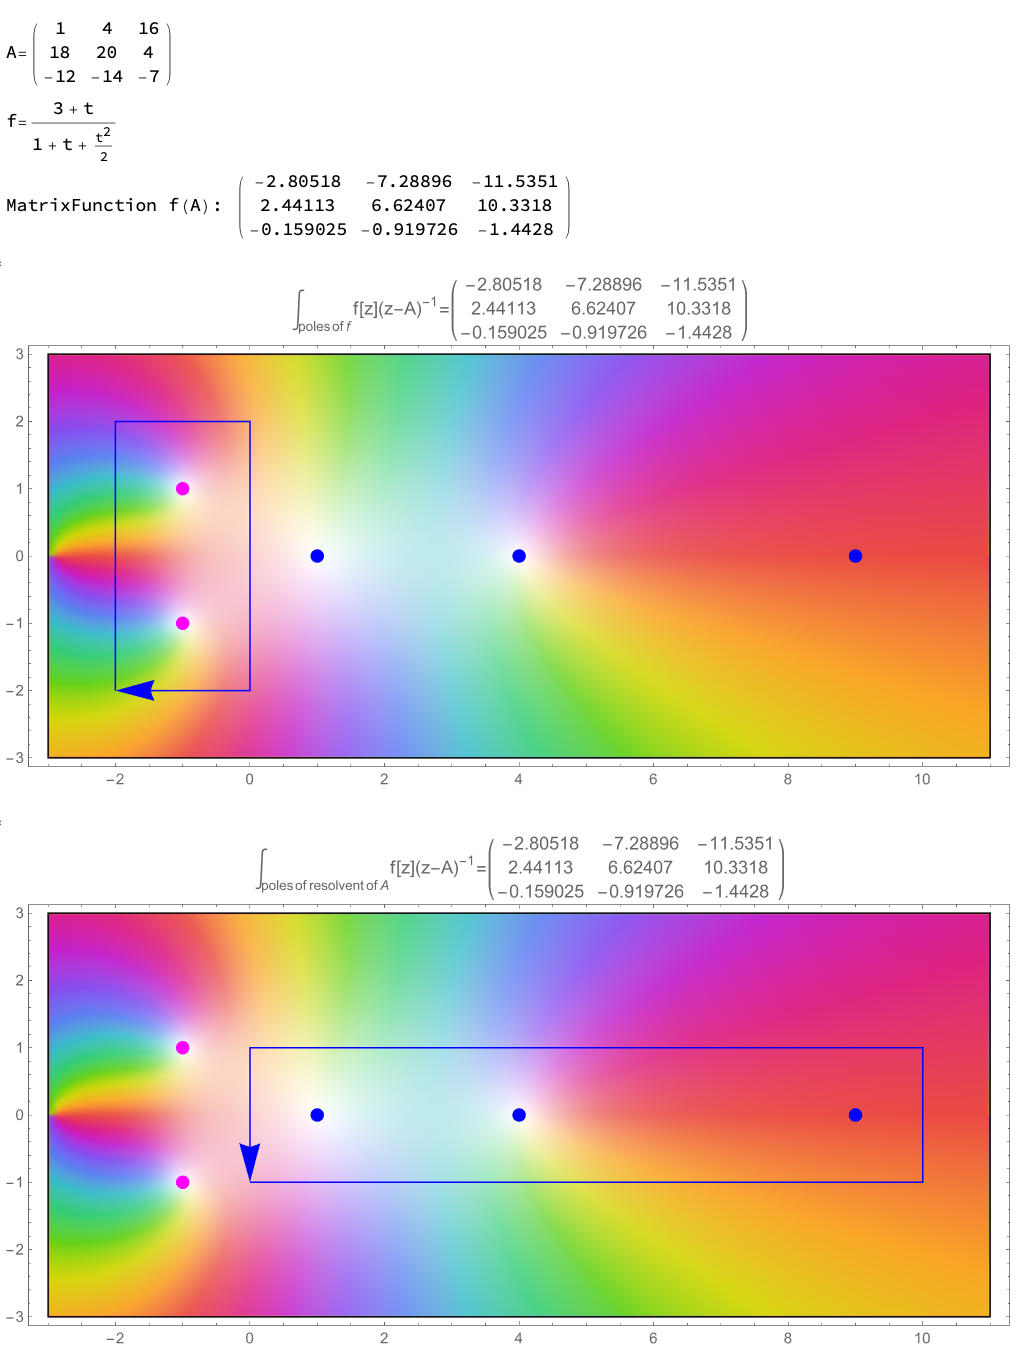
The purpose is for a numerical illustration of alternative approaches to defining matrix function $f(A)$. We get $f(A)$ by contour integrating $f(z)(zI-A)^{-1}dz$ around poles of $f(z)$ or around eigenvalues of $A$. Integrating around both sets of points gives 0. (proof)

Below is an example that works for a simple rectangular contour, however, for other choices of $f$, may need to use non-rectangular contour, and I was looking or an easy way to construct such.

(*** Utilities **)
ClearAll["Global`*"];
On[Assert];
SF = StringForm;
sum[mat_] := Total[mat, 2];

(* given set of imaginary points, find bounds suitable for \
ComplexPlot *)
enclosingBounds[zs_, margin_] := (
   marginVec = {-margin, margin};
   points = ReIm[zs];
   {xb, yb} = {MinMax[First /@ points] + marginVec, 
     MinMax[Last /@ points] + marginVec};
   {First[xb] + I First[yb], Last[xb] + I Last[yb]}
   );

(* Clockwise contour going around 4 points defining bounds *)
boundsToContour[bounds_] := (
   xb = First /@ (ReIm /@ bounds);
   yb = Last /@ (ReIm /@ bounds);
   contour = {{First[xb], First[yb]}, {First[xb], 
      Last[yb]}, {Last[xb], Last[yb]}, {Last[xb], 
      First[yb]}, {First[xb], First[yb]}};
   #1 + I #2 & @@@ contour
   );

(*** Main ***)
A = {{1, 4, 16}, {18, 20, 4}, {-12, -14, -7}};
d = Length[A];
ones = ConstantArray[1, {d}];
ii = DiagonalMatrix[ones];

(* Define ration function f *)
P = t |-> t + 3;
Q = t |-> 1 + t + t^2/2;
f = t |-> P[t]/Q[t];
F[A_] := MatrixFunction[f, A];

eigs = Eigenvalues[A];
roots = t /. {ToRules@Roots[Q[t] == 0, t]};

rootsG = Sequence @@ (Disk[#, .1] & /@ ReIm@roots);
eigsG = Sequence @@ (Disk[#, .1] & /@ ReIm@eigs);


doPlot[contour_, contourName_] := (
   epilog := {Magenta, rootsG, Blue, eigsG, Arrow[ReIm /@ contour]};
   g[z_] := (f[z] Inverse[z ii - A]);
   int = 
    Chop@(1/(2 Pi I)) NIntegrate @@ {g[z], {z, Sequence @@ contour}};
   zbounds = enclosingBounds[roots~Join~eigs, 2];
   ComplexPlot @@ {sum@g@z,
     {z, Sequence @@ zbounds},
     Epilog -> epilog,
     PlotLabel -> 
      SF["\!\(\*SubscriptBox[\(\[Integral]\), \
\(``\)]\)f[z](z-A\!\(\*SuperscriptBox[\()\), \(-1\)]\)=``", 
       contourName, Chop@int]
     }
   );


Print["A=", MatrixForm@A];
Print["f=", f[t]];
Print["MatrixFunction f(A): ", N@MatrixForm@F[A]]

rootContour = boundsToContour@enclosingBounds[roots, 1];
doPlot[rootContour, "poles of f"]

eigContour = Reverse@boundsToContour@enclosingBounds[eigs, 1];
doPlot[eigContour, "poles of resolvent of A"]

enter image description here

Notebook

$\endgroup$
14
  • $\begingroup$ Why do you require the path? As noted in the reply by @RolandF, can you not just use the Cauchy Residue Theorem? $\endgroup$ Commented Apr 20, 2023 at 13:53
  • $\begingroup$ Not clear at all what you're asking. Do you mean numeric contour integration? Do you mean a formulaic contour in terms of $z(t)$? Do you mean for this specific set of points or a list of points in general? Surely if it's just these points, then just a paramaterized polygonal 8 segment key-hole contour enclosing the green points and avoiding the red points would do. $\endgroup$
    – josh
    Commented Apr 20, 2023 at 13:54
  • 1
    $\begingroup$ I was asking for a procedure which takes two sets of points and returns contour enclosing one set, and avoiding the other one. The motivation is for illustration like here -- to show that you can compute $f(A)$ by integrating $f(z)(zI-A)^{-1}$ either clockwise around poles of $f$ or counter-clockwise around poles of $(zI-A)^{-1}$, different choice of contours should give same result @josh $\endgroup$ Commented Apr 20, 2023 at 18:03
  • 1
    $\begingroup$ Yaroslav, Ok. I understand: Given an arbitrary set of points, create a procedure to programatically draw a (paramaterized?) contour around an arbitrary subset of the points. Afraid that sounds problematic for me but maybe others can address it. If so, might it have been better to simply focus solely on this objective without mentioning the complex analysis part? $\endgroup$
    – josh
    Commented Apr 20, 2023 at 20:18
  • 1
    $\begingroup$ NIntegrate[f[z], {z, z1, z2,..., zn}] takes a rectilinear path (in the complex plane) from z1 to z2` to...to zn. $\endgroup$
    – Michael E2
    Commented Apr 23, 2023 at 16:45

2 Answers 2

2
$\begingroup$

If your objective is to construct separate contours around a resonable number of arbitrary poles and eigenvalues to numerically demonstrate

$$ F(A)=\frac{1}{2 \pi i}\oint_{\Gamma{\large\curvearrowright}} f(z)(zI-A)^{-1}dz $$

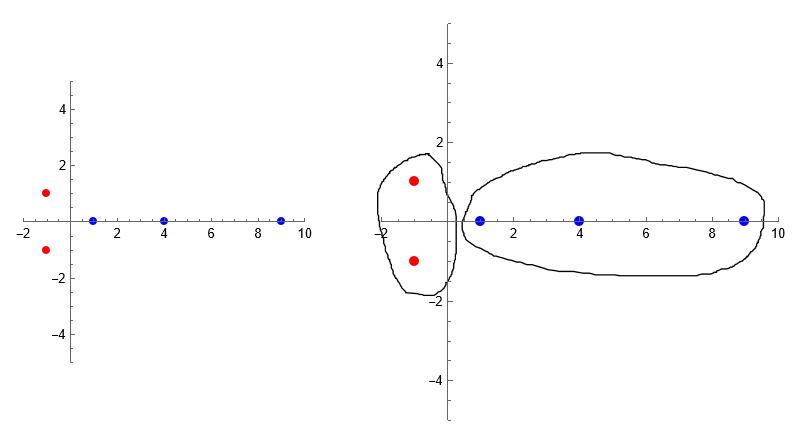
$$ F(A)=\frac{1}{2 \pi i}\oint_{\beta{\large\curvearrowleft}} f(z)(zI-A)^{-1}dz $$ where $\beta{\large\curvearrowleft}$ is a counter clockwise contour around the poles of $f(z)$, and $\Gamma{\large\curvearrowright}$ is a clockwise contour around the eigenvalues of A then one option is draw them free-hand using Mathematica's graphics canvas. See below. If that's acceptable, I can update this post with the details.

enter image description here

Edit:

Before I post the processing of the hand-drawn contours into differentiable functions that can be used with NIntegrate, first make sure you can successfully draw the contours and cut and paste them into variables $\texttt{poleContour}$ and $\texttt{eigenContour}$. I have ver 13.2 which has the Graphics/Convert ToFrom Canvas menu option. Earlier versions were easier, just select Graphics and you can choose from the menu the free-hand icon to draw the contours. I'll describe 13.2 process. First create the function, compute poles and eigenvalues and plot them:

f[z_] := (z + 3)/(1 + z + 1/2 z^2)
A = {{1, 4, 16}, {18, 20, 4}, {-12, -14, -7}};
eVals = Eigenvalues[A];
eValsG = Graphics@{PointSize[0.025], Blue, Point@ReIm@eVals};

inverseF[z_] := Inverse[z IdentityMatrix[3] - A];

poles = t /. NSolve[1 + t + 1/2 t^2, t]
polesG = Graphics@{PointSize[0.025], Red, Point@ReIm@poles};
pointPlot = 
 Show[{polesG, eValsG}, Axes -> True, AspectRatio -> 1, 
  PlotRange -> {{-2, 10}, {-5, 5}}]

F[A_] := MatrixFunction[f, A];
F[A] // N // MatrixForm

Now select the graphic (get orange box around it) and from the menu choose Graphics/Convert ToFrom Canvas. This will draw a dash line around the graphic and present a menu of graphic options below the plot. Choose the free-hand icon. Now using the cursor, carefully draw a contour clockwise around the blue eigenvalues and then a counter clockwise contour around the red poles being careful to try as best as you can to close up the contour at the end. Then reselect the plot (get orange box) then double click on say the contour around the poles to get a graphics of all the points. Then right mouse button, then from menu, choose "Copy graphics selection". Now type in the variable $\texttt{poleContour=}$ and paste the graphics after the equal sign.

Edit:

Once you successfully get the graphic data in $\texttt{poleContour}$ and $\texttt{eigenContour}$, then using Michael's comment above, we can then convert the points in the hand-drawn contours to complex and then integrate $f(z)(zI-A)^{-1}$ sequentally over the list of contour points as per Michael's comment above. Below I do the integration over the eigenvalues with the numerical results accurate to $16$ digits (small residual imag. component). Note I have to "close" the set of points by appending the first point in blueContourPoint back to the integration list:

 blueContourPoints = 
  Flatten[Cases[eigenContour, Line[pts_] :> pts], 1];
blueComplexPoints = (#[[1]] + I #[[2]]) & /@ blueContourPoints;
blueIntResults = 
  1/(2 Pi I) NIntegrate[(f[z] inverseF[z]) , 
    Flatten@{z, blueComplexPoints, blueComplexPoints[[1]]}, 
    MaxRecursion -> 20, AccuracyGoal -> 15];
Style[blueIntResults // N // MatrixForm, 12]
F[A] // N // MatrixForm 
$\endgroup$
6
  • $\begingroup$ Yes that would make a cool demo $\endgroup$ Commented Apr 23, 2023 at 16:43
  • $\begingroup$ @Yaroslav Bulatov: Ok, I described how to create the contours and save to variables $\texttt{poleContour}$ and $\texttt{eigenContour}$. Make sure you can successfully create these then I'll post how to use them to do the integrals (numerically). $\endgroup$
    – josh
    Commented Apr 23, 2023 at 18:06
  • $\begingroup$ Actually just a list of points suffices, as Michael E2 pointed out in comments $\endgroup$ Commented Apr 23, 2023 at 19:18
  • $\begingroup$ Getting an error when I try integrating with list of points. Left Michael a message. Maybe need different syntax. $\endgroup$
    – josh
    Commented Apr 23, 2023 at 20:00
  • $\begingroup$ @Yaroslav Bulatov: Michael's sequential integration is much nicer. I added a second edit above using his help. The integration results are accurate to $F(A)$ to $16$ digits with a small residual imag component. $\endgroup$
    – josh
    Commented Apr 23, 2023 at 20:25
3
$\begingroup$

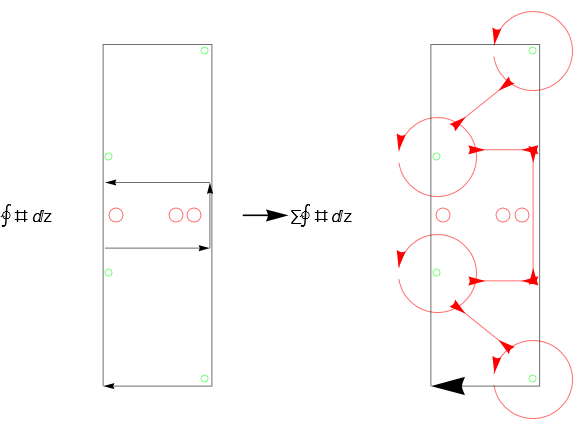
If the integrand is holomorphic (function of z=x+Iy independent of z*= x-I Y) or antiholomorphic (function of z*=x-Iy independent of z= x+I Y) and all the singular points are poles, you simpliy can circumvent the red points by a rectangular deviation to right-down- left.

Since the contour integral for meromorphic functions is contour independent and additive by addition of closed curves to points of the contour, you can deform the rectangular path until it encircles the poles in its inner.

Proceed until each pole is enclosed by a full circle with the circles connected via straight lines, that do not contribute, since the all are passed back and forth.

Finally you can shrink all circles to radius 0. This gives the Residuum it the points, that is the coefficient of Series[ f[z-z_k],{z,z_k} by Cauchy's theorem, because all circle integrals tend to zero with r-> 0 except for the simple poles 1/(z-z_k) in the series expansion, yielding the 2 pi I, independent of the radius.

SetOptions[Graphics, {ImageSize -> Small, Axes -> None }];


Graphics[{
  {Thickness[0.001], Arrowheads[0.02],
   {Text["\[ClockwiseContourIntegral] # \[DifferentialD]z", {-3, 0}], 
    points1G, points2G, 
    Arrow[ReIm /@ boundsToContour@enclosingBounds[points2, .1]], 
    Arrow[{{-1.8`, -1/2}, {-0.2`, -1/2}}],
    Arrow[{{-0.2`, -1/2}, {-0.2`, 1/2}}],
    Arrow[{{-0.2`, 1/2}, {-1.8`, 1/2}}]}},
     {Arrow[{{-0.2, 0}, {0.5, 0}}], 
      Text["\[ClockwiseContourIntegral] # \[DifferentialD]z", 
         {1,  0}]}, {0.5, 0}], 
    Translate[
    {{Thickness[0.001], Arrowheads[0.06], points1G, 
    {Red, Arrowheads[0.03],
     Sequence @@ 
    (Arrow[Circle[#, .6, {-0.95 \[Pi], 0.95 \[Pi]}]] & /@ ReIm@points2)},
    {Red, Arrowheads[{0.03, -0.03}],
    Arrow[{{-1.3, 1.5}, {-0.8, 1.9}}], 
    Arrow[{{-1.3, -1.5}, {-0.8, -1.9}}],
    Arrow[{{-1., -1}, {-0.45, -1}}], Arrow[{{-1., 1}, {-0.45, 1}}],
    Arrow[{ {-0.27, 0.8}, {-0.27, -0.8}}] },
    points2G,
     Arrow[ReIm /@  boundsToContour@enclosingBounds[points2, .1]]}}, 
     {5, 0}]},  ImageSize -> 350]

enter image description here

$\endgroup$
4
  • $\begingroup$ Your direction ",you can deform the rectangular path until it encircles the poles in its inner" is not any algorithm. $\endgroup$
    – user64494
    Commented Apr 20, 2023 at 8:01
  • 3
    $\begingroup$ Your critcal comment does not have any point. This was a graphics question. Not even the class of functions is fixed, so I chose the obvious one. Algorithms for answers of generalized questions belong to the GPT group. $\endgroup$
    – Roland F
    Commented Apr 20, 2023 at 8:14
  • 1
    $\begingroup$ Why did this get a downvote? It is a plausible guess at an underspecified (but nonetheless interesting) question. $\endgroup$ Commented Apr 20, 2023 at 13:55
  • $\begingroup$ Indeed, this is a graphics question, I was looking for easier way to construct contour integration examples like in this post $\endgroup$ Commented Apr 21, 2023 at 19:14

Your Answer

By clicking “Post Your Answer”, you agree to our terms of service and acknowledge you have read our privacy policy.

Not the answer you're looking for? Browse other questions tagged or ask your own question.