12
$\begingroup$

I need to compute following contour integrations:

$$f(u)=\oint_\alpha dz \sqrt{z^3+z+u} \qquad ; \qquad g(u)=\oint_\beta dz \sqrt{z^3+z+u}$$

In which $\alpha$ and $\beta$ are two contours in complex $z$-plane determined by branch points of polynomial under square root. Structure of branch points and cuts are as follows:

For example for $u=0$, there are three roots $\{-i,0,i\}$ and $\alpha$ encircles $\{-i,0\}$ and $\beta$ encircles $\{0,i\}$. So is for other values of $u$ so the contour is dependent on value of $u$.

For numerical integration, and for $f(u)$ we can deform the contours as follows:

And contributions along circles as radius of circles go to zero, vanish and one left with integration along two segments. But integration along bottom segment is exactly as above segment (we circle around a branch point and integrand takes a minus sign):

$$\oint_{\alpha}=2\int_{\text{Upper Segment}}$$

And the same for $g(u)$.

Then I used following code (in this code for $u=0$, $z_1$ corresponds to root $0$,$z_2$ corresponds to root $-i$ and $z_3$ corresponds to root $i$ ):

First Compute roots:

Rs = z /. FullSimplify[Solve[z^3 + z + u == 0, z]];
r[a_][i_] := r[Rs[[i]] /. u -> a]

Then for $f(u)$:

pointlistf = 
Table[{u, NIntegrate[Sqrt[z^3 + z + u], {z, r[u][2], r[u][1]}]}, {u, -1.2, 
1.2, .01}];

f = Interpolation[pointlistf];

Plot[{Re[f[u]], Im[f[u]]}, {u, -1.2, 1.2}, PlotRange -> All, 
PlotStyle -> {{Green, Thickness[0.01]}, {Yellow, Thickness[.01]}}]

Df[u_] := (f[u + a]] - f[u - a])/(2 a) /. a -> 0.000001

Plot[{Re[Da[u]], Im[Da[u]]}, {u, -1.2, 1.2}, PlotRange -> All, 
PlotStyle -> {{Green, Thickness[0.01]}, {Yellow, Thickness[.01]}}]

And Similarly for $g(u)$

pointlistg = 
Table[{u, NIntegrate[Sqrt[z^3 + z + u], {z, r[u][1], r[u][3]}]}, {u, -1.2, 
1.2, .01}];

g = Interpolation[pointlistg];

Plot[{Re[g[u]], Im[g[u]]}, {u, -1.2, 1.2}, PlotRange -> All, 
PlotStyle -> {{Green, Thickness[0.01]}, {Yellow, Thickness[.01]}}]

Dg[u_] := (g[u + a]] - g[u - a])/(2 a) /. a -> 0.000001

Plot[{Re[Dg[u]], Im[Dg[u]]}, {u, -1.2, 1.2}, PlotRange -> All, 
PlotStyle -> {{Green, Thickness[0.01]}, {Yellow, Thickness[.01]}}]

I have several questions:

  • Is my reason for deformation of contour correct?
  • Does my code make sense?
  • How can I put structure of cuts into Mathematica?
  • Is it possible to get an analytic expression for $f(u)$ and $g(u)$ in Mathematica?
  • Is it possible to get an analytic expression for $\frac{\partial f(u)}{\partial u}$ and $\frac{\partial g(u)}{\partial u}$ in Mathematica?
  • Does Cauchy's Theorem applicable in this case? More precisely does presence of branch points break analyticity of function? or is non-trivial value of this integral related to the fact that these contours can't be contracted in one sheet completely and so Cauchy's Theorem is not applicable?

(Sorry I couldn't add "Hi" at the beginning!)

$\endgroup$
3
  • $\begingroup$ Sadly, some of those questions are off-topic because they are related strictly to the mathematical aspect of the problem at hand. BTW Did you use Mathematica to create the plots at the beginning ? $\endgroup$
    – Sektor
    Commented Apr 21, 2015 at 8:20
  • $\begingroup$ Dear @Sektor, No, I used Latex to create them! I asked those question to understand my code better, and I think only the last question is related to mathematical aspect of problem! BTW if you can inform me about questions that are unrelated, I can remove them. Thanks! $\endgroup$
    – QGravity
    Commented Apr 21, 2015 at 12:27
  • $\begingroup$ @QGravity I suggest you make some 3D plots of Re and Im of f to get an impression of how Mathematica interprets the function. You could use With[{u = 0}, Plot3D[Im[Sqrt[z^3 + z + u] /. z -> {x + I y}], {x, -2, 2}, {y, -2, 2}]] with different values of u, and also Re instead of Im. $\endgroup$ Commented May 11, 2015 at 7:16

1 Answer 1

5
$\begingroup$

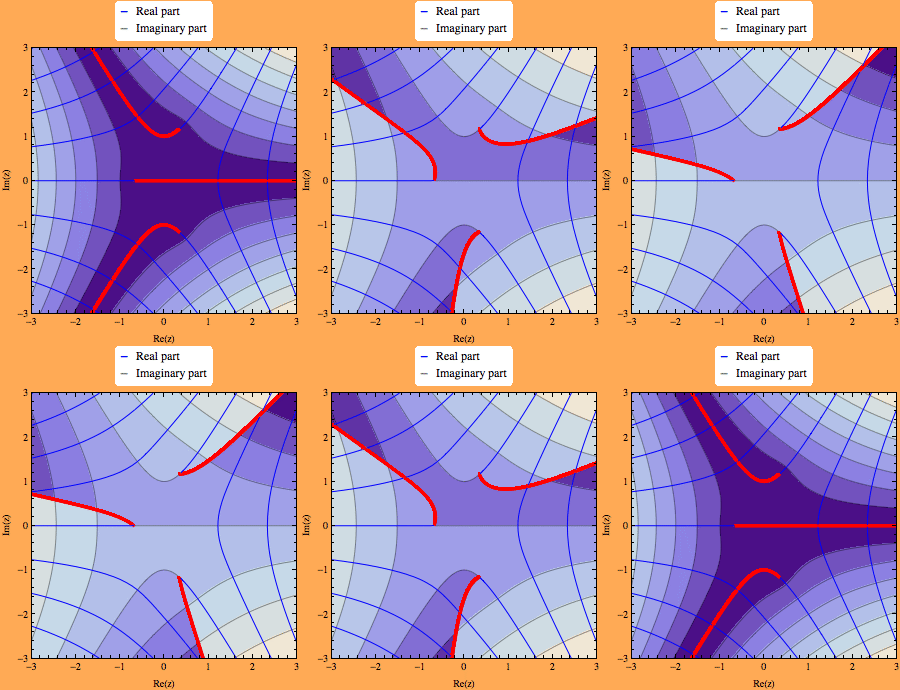
The choice of branch cuts is made by re-defining the argument of the complex number under the square root. This can be done by using the approach of this answer:

arg[z_, σ_: - Pi] := 
  Arg[z Exp[-I (σ + Pi)]] + σ + Pi;

sqrt[x_, σ_: - Pi] := Sqrt[Abs[x]] Exp[I arg[x, σ]/2]

Here, the parameter $\sigma$ is the location of the branch cut of the square root. Next, apply it to the example in the question by setting u=1. To show the resulting branch cut locations, I will use the same function plot as in the linked answer:

plot[f_] := 
 Module[{fn = f /. z -> x + I y}, 
  Show[ContourPlot[Im[fn], {x, -3, 3}, {y, -3, 3}, 
    ContourShading -> Automatic, ExclusionsStyle -> Red], 
   ContourPlot[Re[fn], {x, -3, 3}, {y, -3, 3}, 
    ContourShading -> False, ContourStyle -> Blue, 
    ExclusionsStyle -> Red], FrameLabel -> {"Re(z)", "Im(z)"}, 
   Background -> Lighter[Orange], PlotRangePadding -> 0, 
   PlotLabel -> 
    Framed[Grid[{{Style["-", Bold, Blue], 
        "Real part"}, {Style["-", Bold, Gray], "Imaginary part"}}, 
      Alignment -> Left], FrameStyle -> None, Background -> White, 
     RoundingRadius -> 5], ImageSize -> 300]]

l = Table[
   plot[sqrt[z^3 + z + 1, σ]], {σ, 0, Pi, .37/3}];

ListAnimate[l]

branch cuts

This shows that the branch cuts are not as simple as you sketched. In particular, there seems to be no choice of $\sigma$ for which the branch cuts for any given pair of branch points can be localized to a finite line. You can get that for something like $\log((z-1)/(z+1))$ with the definition in my linked answer and $\sigma = -\pi$, but it doesn't work for your function. This leads me to conclude that the rest of the question is then not based on a correct premise.

$\endgroup$
1
  • $\begingroup$ Dear@Jens , Thanks for you answer but the problem that I have is to calculate these integrals over contours that I depicted in my question. It is a prescription. The problem is to compute the period matrix of torus (which can be constructed using a cut complex plane and It seems to me impossible to construct it using the branch cuts of your answer because no two branch points are linked together). I got totally confused by your answer because as you mentioned, it seems that the loci of branch cuts (Red Curves) are infinite lines from the location of zeroes of polynomial to infinity. $\endgroup$
    – QGravity
    Commented Aug 11, 2015 at 14:38

Your Answer

By clicking “Post Your Answer”, you agree to our terms of service and acknowledge you have read our privacy policy.

Not the answer you're looking for? Browse other questions tagged or ask your own question.