added 87 characters in body
Source Link
Yaroslav Bulatov
  • 6.7k
  • 1
  • 21
  • 47

The purpose is for a numerical illustration of alternative approaches to defining matrix function $f$$f(A)$. We can either integrateget $f(A)$ by contour integrating $f(z)(zI-A)^{-1}dz$ around poles of $f(z)$ or polesaround eigenvalues of $(zI-A)^{-1}$$A$. Integrating around both sets of points gives 0. (proof)

The purpose is for a numerical illustration of alternative approaches to defining matrix function $f$. We can either integrate around poles of $f(z)$ or poles of $(zI-A)^{-1}$ (proof)

The purpose is for a numerical illustration of alternative approaches to defining matrix function $f(A)$. We get $f(A)$ by contour integrating $f(z)(zI-A)^{-1}dz$ around poles of $f(z)$ or around eigenvalues of $A$. Integrating around both sets of points gives 0. (proof)

added 1111 characters in body
Source Link
Yaroslav Bulatov
  • 6.7k
  • 1
  • 21
  • 47

The purpose is for a numerical illustration of alternative approaches to defining matrix function $f$. We can either integrate around poles of $f(z)$ or poles of $(zI-A)^{-1}$ (proof)

Below is an example of findingthat works for a simple rectangular contour enclosing points2, which ends up catching points insidehowever, for other choices of points1 as well$f$, may need to use non-rectangular contour, and I was looking or an easy way to construct such.

points1 = {-1.6300469260320778`,(*** -0.7155740724749874`,Utilities \**)
-0.4318795524738263`};ClearAll["Global`*"];
points2On[Assert];
SF = {-1.7294442310677054` - StringForm;
   sum[mat_] 0.8889743761218658`:= ITotal[mat, -1.7294442310677054` + 2];
    0.8889743761218658` I, -0.27055576893229455` - 
(* given set of 2.5047759043624347`imaginary Ipoints, -0.27055576893229455` + 
find bounds suitable for 2.5047759043624347`\
ComplexPlot I};*)
enclosingBounds[zs_, margin_] := (
   marginVec = {-margin, margin};
   points = ReIm[zs];
   {xb, yb} = {MinMax[First /@ points] + marginVec, 
     MinMax[Last /@ points] + marginVec};
   {First[xb] + I First[yb], Last[xb] + I Last[yb]});

points1G = {Red, Sequence @@ (Circle[#, .1] & /@ ReIm@points1)};
points2G = {Green, Sequence @@  
(Circle[#,* .05]Clockwise &contour /@going ReIm@points2)};

(*Returnsaround clockwise4 contourpoints fordefining givenbounds bounds**)
boundsToContour[bounds_] := (
   xb = First /@ (ReIm /@ bounds);
   yb = Last /@ (ReIm /@ bounds);
   contour = {{First[xb], First[yb]}, {First[xb], 
      Last[yb]}, {Last[xb], Last[yb]}, {Last[xb], 
      First[yb]}, {First[xb], First[yb]}};
   #1 + I #2 & @@@ contour
   );
Graphics[
(*** Main ***)
A = {points1G{1, points2G4, 16}, {18, 20, 4}, {-12, -14, -7}};
d = Arrow[ReImLength[A];
ones = ConstantArray[1, {d}];
ii = DiagonalMatrix[ones];

(* Define ration function f *)
P = t |-> t + 3;
Q = t |-> 1 + t + t^2/2;
f = t |-> P[t]/Q[t];
F[A_] := MatrixFunction[f, A];

eigs = Eigenvalues[A];
roots = t /. {ToRules@Roots[Q[t] == 0, t]};

rootsG = Sequence @@ (Disk[#, .1] & /@ boundsToContour@enclosingBounds[points2ReIm@roots);
eigsG = Sequence @@ (Disk[#, .1]]1] & /@ ReIm@eigs);


doPlot[contour_, contourName_] := (
   epilog := {Magenta, rootsG, Blue, eigsG, Arrow[ReIm /@ contour]}];
   g[z_] := (f[z] Inverse[z ii - A]);
   int = 
    Chop@(1/(2 Pi I)) NIntegrate @@ {g[z], {z, Sequence @@ contour}};
   zbounds = enclosingBounds[roots~Join~eigs, 2];
   ComplexPlot @@ {sum@g@z,
     {z, Sequence @@ zbounds},
     Epilog -> epilog,
     PlotLabel -> 
      SF["\!\(\*SubscriptBox[\(\[Integral]\), \
\(``\)]\)f[z](z-A\!\(\*SuperscriptBox[\()\), \(-1\)]\)=``", 
       contourName, Chop@int]
     }
   );


Print["A=", MatrixForm@A];
Print["f=", f[t]];
Print["MatrixFunction f(A): ", N@MatrixForm@F[A]]

rootContour = boundsToContour@enclosingBounds[roots, 1];
doPlot[rootContour, "poles of f"]

eigContour = Reverse@boundsToContour@enclosingBounds[eigs, 1];
doPlot[eigContour, "poles of resolvent of A"]

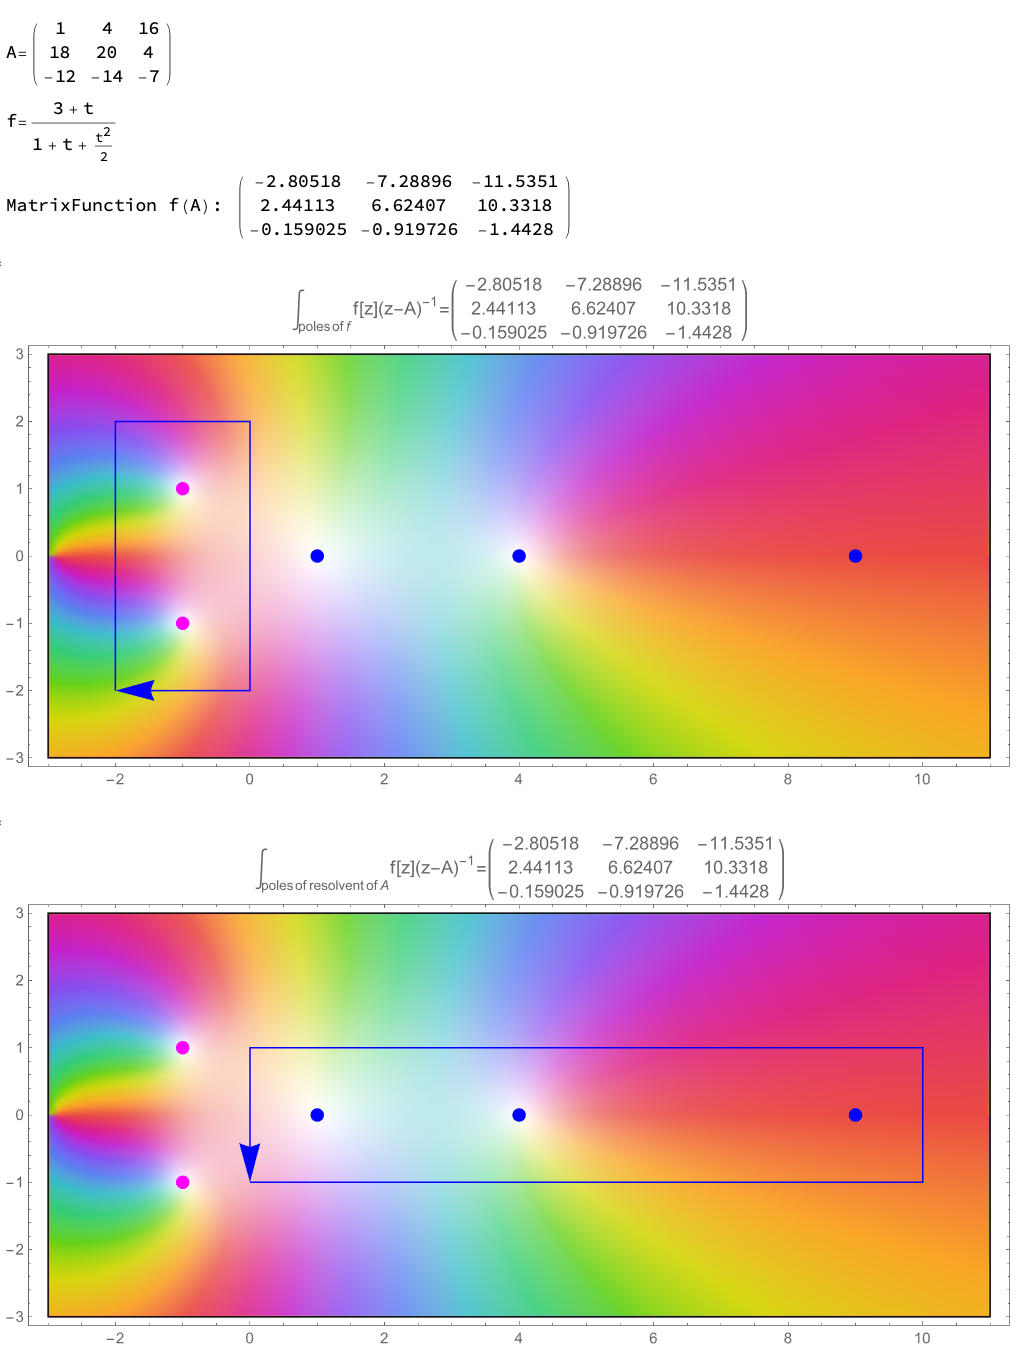
enter image description hereenter image description here

Background -- different sets of poles give different ways of computing the same resultNotebook

Below is an example of finding contour enclosing points2, which ends up catching points inside points1 as well

points1 = {-1.6300469260320778`, -0.7155740724749874`, \
-0.4318795524738263`};
points2 = {-1.7294442310677054` - 
    0.8889743761218658` I, -1.7294442310677054` + 
    0.8889743761218658` I, -0.27055576893229455` - 
    2.5047759043624347` I, -0.27055576893229455` + 
    2.5047759043624347` I};
enclosingBounds[zs_, margin_] := (marginVec = {-margin, margin};
   points = ReIm[zs];
   {xb, yb} = {MinMax[First /@ points] + marginVec, 
     MinMax[Last /@ points] + marginVec};
   {First[xb] + I First[yb], Last[xb] + I Last[yb]});

points1G = {Red, Sequence @@ (Circle[#, .1] & /@ ReIm@points1)};
points2G = {Green, Sequence @@ (Circle[#, .05] & /@ ReIm@points2)};

(*Returns clockwise contour for given bounds*)
boundsToContour[bounds_] := (xb = First /@ (ReIm /@ bounds);
   yb = Last /@ (ReIm /@ bounds);
   contour = {{First[xb], First[yb]}, {First[xb], 
      Last[yb]}, {Last[xb], Last[yb]}, {Last[xb], 
      First[yb]}, {First[xb], First[yb]}};
   #1 + I #2 & @@@ contour);
Graphics[{points1G, points2G, 
  Arrow[ReIm /@ boundsToContour@enclosingBounds[points2, .1]]}]

enter image description here

Background -- different sets of poles give different ways of computing the same result

The purpose is for a numerical illustration of alternative approaches to defining matrix function $f$. We can either integrate around poles of $f(z)$ or poles of $(zI-A)^{-1}$ (proof)

Below is an example that works for a simple rectangular contour, however, for other choices of $f$, may need to use non-rectangular contour, and I was looking or an easy way to construct such.

(*** Utilities **)
ClearAll["Global`*"];
On[Assert];
SF = StringForm;
sum[mat_] := Total[mat, 2];

(* given set of imaginary points, find bounds suitable for \
ComplexPlot *)
enclosingBounds[zs_, margin_] := (
   marginVec = {-margin, margin};
   points = ReIm[zs];
   {xb, yb} = {MinMax[First /@ points] + marginVec, 
     MinMax[Last /@ points] + marginVec};
   {First[xb] + I First[yb], Last[xb] + I Last[yb]}
   );
 
(* Clockwise contour going around 4 points defining bounds *)
boundsToContour[bounds_] := (
   xb = First /@ (ReIm /@ bounds);
   yb = Last /@ (ReIm /@ bounds);
   contour = {{First[xb], First[yb]}, {First[xb], 
      Last[yb]}, {Last[xb], Last[yb]}, {Last[xb], 
      First[yb]}, {First[xb], First[yb]}};
   #1 + I #2 & @@@ contour
   );

(*** Main ***)
A = {{1, 4, 16}, {18, 20, 4}, {-12, -14, -7}};
d = Length[A];
ones = ConstantArray[1, {d}];
ii = DiagonalMatrix[ones];

(* Define ration function f *)
P = t |-> t + 3;
Q = t |-> 1 + t + t^2/2;
f = t |-> P[t]/Q[t];
F[A_] := MatrixFunction[f, A];

eigs = Eigenvalues[A];
roots = t /. {ToRules@Roots[Q[t] == 0, t]};

rootsG = Sequence @@ (Disk[#, .1] & /@ ReIm@roots);
eigsG = Sequence @@ (Disk[#, .1] & /@ ReIm@eigs);


doPlot[contour_, contourName_] := (
   epilog := {Magenta, rootsG, Blue, eigsG, Arrow[ReIm /@ contour]};
   g[z_] := (f[z] Inverse[z ii - A]);
   int = 
    Chop@(1/(2 Pi I)) NIntegrate @@ {g[z], {z, Sequence @@ contour}};
   zbounds = enclosingBounds[roots~Join~eigs, 2];
   ComplexPlot @@ {sum@g@z,
     {z, Sequence @@ zbounds},
     Epilog -> epilog,
     PlotLabel -> 
      SF["\!\(\*SubscriptBox[\(\[Integral]\), \
\(``\)]\)f[z](z-A\!\(\*SuperscriptBox[\()\), \(-1\)]\)=``", 
       contourName, Chop@int]
     }
   );


Print["A=", MatrixForm@A];
Print["f=", f[t]];
Print["MatrixFunction f(A): ", N@MatrixForm@F[A]]

rootContour = boundsToContour@enclosingBounds[roots, 1];
doPlot[rootContour, "poles of f"]

eigContour = Reverse@boundsToContour@enclosingBounds[eigs, 1];
doPlot[eigContour, "poles of resolvent of A"]

enter image description here

Notebook

edited tags
Link
user64494
  • 29.1k
  • 4
  • 29
  • 56
edited title
Link
user64494
  • 29.1k
  • 4
  • 29
  • 56
Loading
Source Link
Yaroslav Bulatov
  • 6.7k
  • 1
  • 21
  • 47
Loading