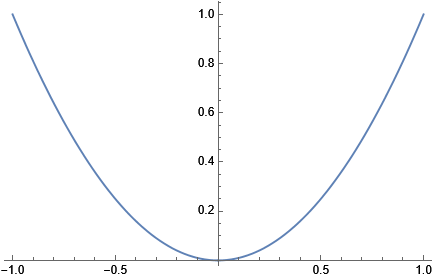
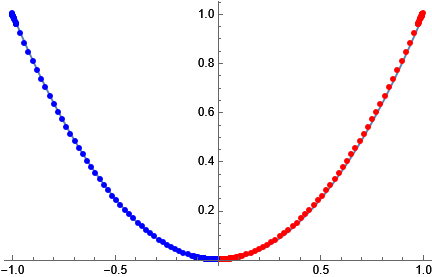
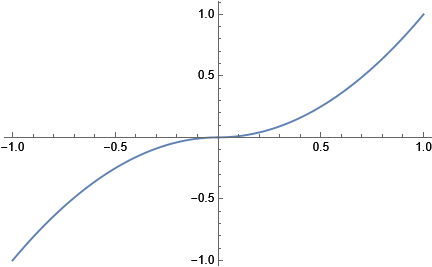
I have an even function $f(x)$ that I wish to plot on the interval $x \in [-1,1]$. The evaluation of $f(x)$ at a given point takes a bit of time to compute, so I would want to evaluate $f(x)$ only on the interval $x \in [0,1]$ and plot the rest by making use of the evenness of the function. For example, if I do:
myf[x_] := (Pause[0.01]; x^2)
Show[Plot[myf[x], {x, 0, 1}], Plot[myf[x], {x, -1, 0}]],
the second plot is actually a waste.
I could manually make an array of $f(x_i)$ at different points $x_i \in [0,1]$, set $f(-x_i) = f(x_i)$ and then use ListPlot, but I feel that there should be a quicker way to do this. Ideally, something of the sort of using Plot[myf[x], {x, 0, 1}], copy it, make a mirror image of it, stick the two plots together and show the result?


