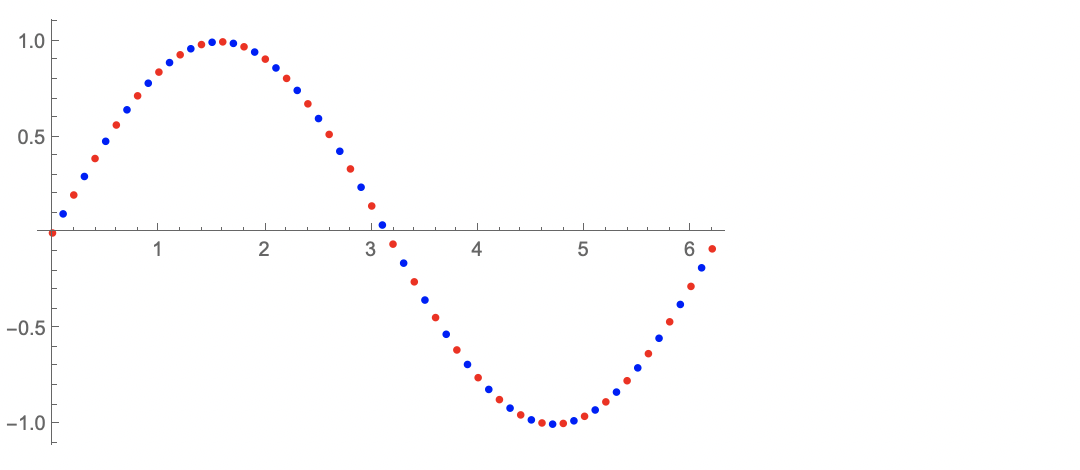
I have two lists produce by a script that are most likely identical (but might not be).
I would like to plot them using ListPlot[] in such a way to display only even elements from the first list and odd elements from the second one, essentially interleaving the two lists. Goal is to show that the two are in fact overlapping.
Sample data is just two identical lists such as
a = Table[y,{y,1,20}];
b = Table[y,{y,1,20}];
My lists come without x coordinates but can be added if needed.


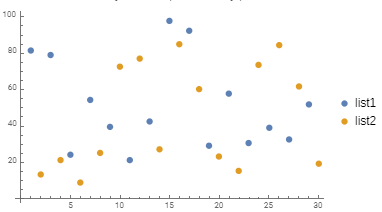
ListPlot[{list1[[;; ;; 2]], list2[[2 ;; ;; 2]]}]? $\endgroup$