0
$\begingroup$

My intention is to place the values of two function into a small box within my chart. To be more precise I have two vectors.

A meanvector which shows the average value of all simulated stochastic processes and an other vector, namely thresholdedmeanvector which represents the average value only of those processes which remain beyond the in the function defined threshold.

So I just want a box somewhere in the chart with the titles “mean of all stochastic processes” and below the displayed value of this vector at the end of the period (which is defined as “time” in the code) and the title “mean of all stochastic processes beyond the threshold” next to it, which also displays the value of the average of the stochastic processes which remained beyond the threshold at the end of the period (again defined as “time”)

In the first step, I tried just to display the mean value of all stochastic processes somewhere in the chart. Therefore I uses the Grid Function, but I am struggling with it. I think I have placed it somewhere in a wrong position in the function, but I am not sure.

Does anyone of you have a suggestion where I should place the Grid Function or an easier alternative? Thanks, and below you can find the underlying code.

Manipulate[SeedRandom[seed]; meanvector := Mean[assets]; 
 assets = Table[RandomFunction[
GeometricBrownianMotionProcess[μ, σ, S0], {0, time, 0.1}]["Path"], {P}];


 processes = Transpose[assets[[#]]][[2]] & /@ Range@Length[assets]; 
 processesposition = Flatten[Position[
Min[processes[[#]]] & /@ Range@Length[assets], _?(# > threshold &)]]; 


 thresholdedassets = assets[[#]] & /@ processesposition; 
 thresholdedmeanvector = Mean[thresholdedassets];


 (*vector of meanvector*)
 vmv = TableView[{meanvector, NumberForm[meanvector, {4, 5}]}, {0, time}]; 

 vmv = Prepend[
   vmv, {"Mean Value of all Assets and the end of the period"}];

 G1 := ListLogPlot[assets, GridLines -> {{}, {threshold}}, 
   GridLinesStyle -> Directive[Green, Thick], Joined -> True, 
   AxesLabel -> {"Time", "St"}, 
   PlotLabel -> Style["Forecasted Stock Price\n (Brownian Motion)", Bold], 
   PlotRange -> All, PlotStyle -> Directive[{Thin, Lighter@Gray}]];

 G2 := ListLogPlot[{meanvector, thresholdedmeanvector}, 
   Joined -> True, 
   PlotStyle -> {Directive[{Thick, Darker@Red}], 
     Directive[{Thick, Darker@Blue}]}];

 (*introduction of Grid Box for meanvector*)

 Grid[{Text@ Grid[vmv, Alignment -> Left, Frame -> All,ItemStyle -> {Automatic, {Bold}}],


   Show[G1, G2]}],

 {{S0, 100, "Initial Stock Value"}, 1, 500, 0.5, Appearance -> "Labeled"}, 
 {{μ, 0.08, "Drift μ"}, 0.01, 0.2, 0.01, Appearance -> "Labeled"}, 
 {{σ, 0.2, "Standard Deviation σ"}, 0.01, 1, 0.05, 
  Appearance -> "Labeled"},
 {{P, 6, "Paths"}, 1, 20, 1,Appearance -> "Labeled"}, 
 {{time, 10, "Time t"}, 1, 20, 1, Appearance -> "Labeled"},  
 {{threshold, 75, "Debt Level"}, 1, 500, Appearance -> "Labeled"},  
 Delimiter, {{seed, 0, ""},Button["randomize", seed = RandomInteger[2^64 - 1]] &},  

 Button["Set Initial Values", {S0 = 100, μ = 0.08, σ = 
    0.20, P = 6, time = 10, threshold = 75}, ImageSize -> 150], 
 ControlPlacement -> Left]
$\endgroup$
2
  • $\begingroup$ The code you present gives me a rather large list for vmw where I think it is supposed to be a single value? In any case, if you are looking to place text on a plot you should look at Epilog. $\endgroup$ Commented Jun 7, 2013 at 12:56
  • $\begingroup$ Or look at the function Inset --- some of the examples in the Applications section might be helpful. $\endgroup$
    – bill s
    Commented Jun 7, 2013 at 13:09

1 Answer 1

1
$\begingroup$

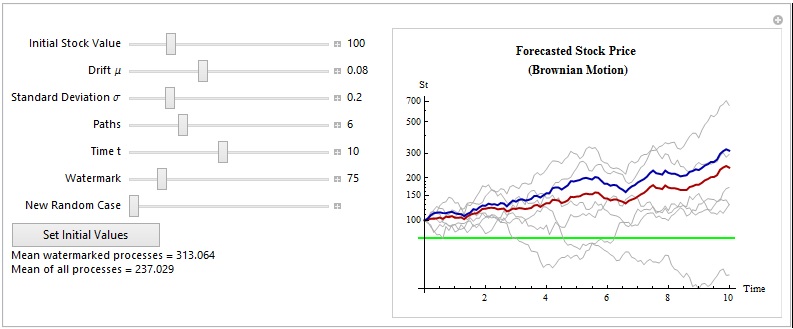
Milan, the easiest way to do it is by using Dynamic[].

Manipulate[SeedRandom[seed];
meanvector := Mean[assets];
assets = Table[RandomFunction[GeometricBrownianMotionProcess[μ, σ, S0], {0, time, 0.1}]["Path"], {P}];
processes = Transpose[assets[[#]]][[2]] & /@ Range@Length[assets];
processesposition=Flatten[Position[Min[processes[[#]]]&/@Range@Length[assets], _?(# > watermark &)]];
watermarkedassets = assets[[#]] & /@ processesposition;
watermarkedmeanvector = Mean[watermarkedassets];
G1 := ListLogPlot[assets, GridLines -> {{}, {watermark}},GridLinesStyle -> Directive[Green, Thick], Joined -> True, AxesLabel -> {"Time", "St"}, PlotLabel -> Style["Forecasted Stock Price\n (Brownian Motion)", Bold], PlotRange -> All, PlotStyle -> Directive[{Thin, Lighter@Gray}]];
G2 := ListLogPlot[{meanvector, watermarkedmeanvector},Joined -> True, PlotStyle -> {Directive[{Thick, Darker@Red}], Directive[{Thick, Darker@Blue}]}];
Show[G1, G2], 
{{S0, 100, "Initial Stock Value"}, 1, 500, 0.5, Appearance -> "Labeled"}, 
{{μ, 0.08, "Drift μ"}, 0.01, 0.2, 0.01, Appearance -> "Labeled"}, 
{{σ, 0.2, "Standard Deviation σ"}, 0.01, 1, 0.05, Appearance -> "Labeled"}, 
{{P, 6, "Paths"}, 1, 20, 1, Appearance -> "Labeled"}, 
{{time, 10, "Time t"}, 1, 20, 1, Appearance -> "Labeled"}, 
{{watermark, 75, "Watermark"}, 1, 500, Appearance -> "Labeled"}, 
{{seed, 1, "New Random Case"}, 1, 100, 1}, 
Button["Set Initial Values", {S0 = 100, μ = 0.08, σ = 0.20, P = 6, time = 10, watermark = 75}, ImageSize -> 150], 
Dynamic["Mean watermarked processes = "<>ToString[watermarkedmeanvector[[-1]][[2]]]],
Dynamic["Mean of all processes = "<>ToString[meanvector[[-1]][[2]]]],    
ControlPlacement -> Left]

enter image description here

$\endgroup$
14
  • $\begingroup$ Two thumbs up for you! :D $\endgroup$ Commented Jun 7, 2013 at 13:33
  • $\begingroup$ @ Rod Lm thank you again. I have just tried to modify your code slightly by just introducing a second watermark and a third mean process. I think there is one error in my code, or I am maybe not considering here. can I post my code somewhere here without asking a new question? because its just a slight chante? $\endgroup$ Commented Jun 7, 2013 at 14:39
  • $\begingroup$ @MilanIvica What exactly do you want to do? Maybe I can help you... $\endgroup$
    – Rod
    Commented Jun 7, 2013 at 14:40
  • $\begingroup$ @ Rod Lm Just introduce a second watermark which is lower than the first one. and also calculate the mean of all processes which remain beyond the second watermark. so exactly the same but just one watermark more which is lower than the first one $\endgroup$ Commented Jun 7, 2013 at 14:42
  • $\begingroup$ @MilanIvica Maybe you could try to define watermark2 and compute it's mean exactly as for the original watermark variable. $\endgroup$
    – Rod
    Commented Jun 7, 2013 at 14:59

Your Answer

By clicking “Post Your Answer”, you agree to our terms of service and acknowledge you have read our privacy policy.

Not the answer you're looking for? Browse other questions tagged or ask your own question.