1
$\begingroup$

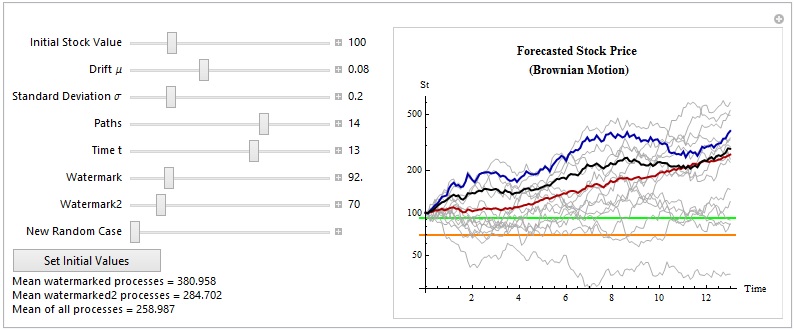
I have the following problem: I have a watermark in this model where not only the mean of all stochastic processes is calculated, but also the mean of those processes which remain beyond a given threshold/ watermark. Now, I want to introduce a second watermark which is lower than the first one. And I also want to calculate and display the mean of the stochastic processes which are beyond the second watermark.

My code so far is:

Manipulate[SeedRandom[seed]; meanvector := Mean[assets]; 
 assets = Table[
   RandomFunction[
     GeometricBrownianMotionProcess[μ, σ, S0], {0, time, 
      0.1}]["Path"], {P}]; 
 processes = Transpose[assets[[#]]][[2]] & /@ Range@Length[assets];
 processes2 = Transpose[assets[[#]]][[2]] & /@ Range@Length[assets]; 
 processesposition = 
  Flatten[Position[
    Min[processes[[#]]] & /@ 
     Range@Length[assets], _?(# > watermark &)]];
 processesposition2 = 
  Flatten[Position[
    Min[processes2[[#]]] & /@ 
     Range@Length[assets], _?(# > watermark2 &)]];
watermarkedassets = assets[[#]] & /@ processesposition; 
 watermarkedmeanvector = Mean[watermarkedassets];
 watermarkedassets2 = assets[[#]] & /@ processesposition2; 
 watermarkedmeanvector2 = Mean[watermarkedassets2];

 G1 := ListLogPlot[assets, GridLines -> {{}, {watermark}}, 
    GridLinesStyle -> {Directive[Green, Thick]}, Joined -> True, 
    AxesLabel -> {"Time", "St"}, 
    PlotLabel -> 
     Style["Forecasted Stock Price\n (Brownian Motion)", Bold], 
    PlotRange -> All, PlotStyle -> Directive[{Thin, Lighter @ Gray}]];

 G2 := ListLogPlot[{meanvector, watermarkedmeanvector, 
     watermarkedmeanvector2, GridLines -> {{}, {watermark2}}, 
     GridLinesStyle -> {Directive[Orange, Thick]}}, Joined -> True, 
    PlotStyle -> {Directive[{Thick, Darker @ Red}], 
      Directive[{Thick, Darker @ Blue}], 
      Directive[{Thick, Darker @ Pink}]}];


 Show[G1, G2], {{S0, 100, "Initial Stock Value"}, 1, 500, 0.5, 
  Appearance -> "Labeled"}, {{μ, 0.08, "Drift μ"}, 0.01, 0.2, 
  0.01, Appearance -> "Labeled"}, {{σ, 0.2, 
   "Standard Deviation σ"}, 0.01, 1, 0.05, 
  Appearance -> "Labeled"}, {{P, 6, "Paths"}, 1, 20, 1, 
  Appearance -> "Labeled"}, {{time, 10, "Time t"}, 1, 20, 1, 
  Appearance -> "Labeled"}, {{watermark, 75, "Watermark"}, 1, 500, 
  Appearance -> "Labeled"},
 {{watermark2, 70, "Watermark2"}, 1, 500, Appearance -> "Labeled"},
 {{seed, 1, "New Random Case"}, 1, 100, 1}, 
 Button["Set Initial Values", {S0 = 100, μ = 0.08, σ = 
    0.20, P = 6, time = 10, watermark = 75, watermark2 = 70}, 
  ImageSize -> 150],

 Dynamic["Mean watermarked processes = " <> 
   ToString[watermarkedmeanvector[[-1]][[2]]]],
 Dynamic["Mean watermarked2 processes = " <> 
   ToString[watermarkedmeanvector2[[-1]][[2]]]], 
 Dynamic["Mean of all processes = " <> 
   ToString[meanvector[[-1]][[2]]]], ControlPlacement -> Left]

Do you have any suggestions?

$\endgroup$

1 Answer 1

4
$\begingroup$

I think this is what you need. I'm posting the answer here, so that future users can also implement and use the code.

Manipulate[SeedRandom[seed]; meanvector := Mean[assets];
assets = Table[RandomFunction[GeometricBrownianMotionProcess[μ, σ, S0], {0, time, 0.1}]["Path"], {P}];
processes = Transpose[assets[[#]]][[2]] & /@ Range@Length[assets];
processesposition = Flatten[Position[Min[processes[[#]]] & /@ Range@Length[assets], _?(# > watermark &)]];
processesposition2 = Flatten[Position[Min[processes[[#]]] & /@ Range@Length[assets], _?(# > watermark2 &)]];
watermarkedassets = assets[[#]] & /@ processesposition;
watermarkedassets2 = assets[[#]] & /@ processesposition2;
watermarkedmeanvector = Mean[watermarkedassets];
watermarkedmeanvector2 = Mean[watermarkedassets2];
G1 := ListLogPlot[assets, GridLines -> {{}, {{watermark, Directive[Green, Thick]}, {watermark2, Directive[Orange, Thick]}}}, Joined -> True, AxesLabel -> {"Time", "St"}, PlotLabel -> Style["Forecasted Stock Price\n (Brownian Motion)", Bold], PlotRange -> All, PlotStyle -> Directive[{Thin, Lighter@Gray}]];
G2 := ListLogPlot[{meanvector, watermarkedmeanvector, watermarkedmeanvector2}, Joined -> True, PlotStyle -> {Directive[{Thick, Darker@Red}], Directive[{Thick, Darker@Blue}], Directive[{Thick, Black}]}];
Show[G1, G2], {{S0, 100, "Initial Stock Value"}, 1, 500, 0.5, 
Appearance -> "Labeled"}, 
{{μ, 0.08, "Drift μ"}, 0.01, 0.2, 0.01, Appearance -> "Labeled"}, 
{{σ, 0.2, "Standard Deviation σ"}, 0.01, 1, 0.05, Appearance -> "Labeled"}, 
{{P, 6, "Paths"}, 1, 20, 1, Appearance -> "Labeled"}, 
{{time, 10, "Time t"}, 1, 20, 1, Appearance -> "Labeled"}, 
{{watermark, 75, "Watermark"}, 1, 500, Appearance -> "Labeled"}, 
{{watermark2, 70, "Watermark2"}, 1, 500, Appearance -> "Labeled"}, 
{{seed, 1, "New Random Case"}, 1, 100, 1},
Button["Set Initial Values", {S0 = 100, μ = 0.08, σ = 0.20, P = 6, time = 10, watermark = 75, watermark2 = 70}, ImageSize -> 150], 
Dynamic["Mean watermarked processes = " <> ToString[watermarkedmeanvector[[-1]][[2]]]], 
Dynamic["Mean watermarked2 processes = " <> ToString[watermarkedmeanvector2[[-1]][[2]]]], 
Dynamic["Mean of all processes = " <> ToString[meanvector[[-1]][[2]]]],
ControlPlacement -> Left]

Final result:

enter image description here

$\endgroup$

Your Answer

By clicking “Post Your Answer”, you agree to our terms of service and acknowledge you have read our privacy policy.

Not the answer you're looking for? Browse other questions tagged or ask your own question.