1
$\begingroup$

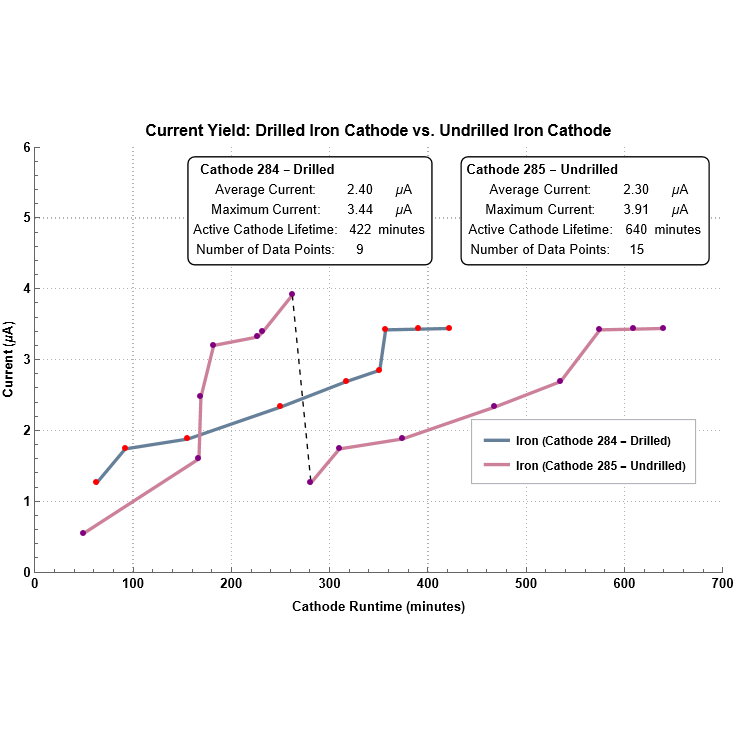
I would like to plot 2 series of data on a ListLinePlot. One is made up of a single line, one is split. Each one would ideally be separately coloured lines and noted in the legend.

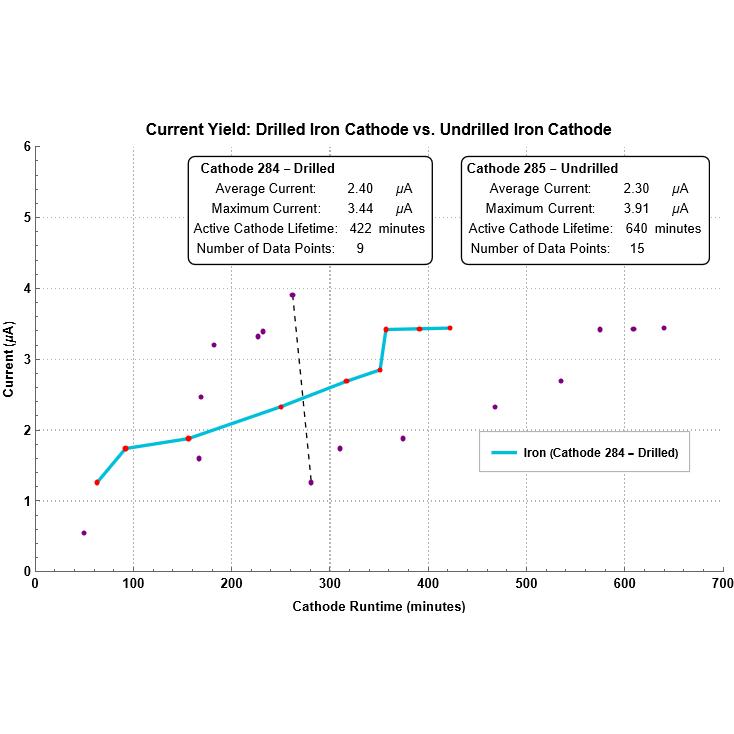
I think I've managed to transfer most of my code for a single series into a plot with two, and I can get the points to appear and the calculations to complete and the epilog appear, but not the actual line.

Can anyone help me with getting the line / legend to appear? I believe the problem is likely something to do with how the brackets are laid out near where it says LineLinePlot[{set[1]}

  dataSet = {{63, 1.26}, {92, 1.74}, {156, 1.88}, {250, 2.33}, {317, 
    2.69}, {351, 2.85}, {357, 3.42}, {391, 3.43}, {422, 3.44}};
dataSet2 = {{50, 0.55}, {167, 1.6}, {169, 2.47}, {182, 3.2}, {227, 
    3.32}, {232, 3.39}, {262, 3.91}, {281, 1.26}, {310, 1.74}, {374, 
    1.88}, {468, 2.33}, {535, 2.69}, {575, 3.42}, {609, 3.43}, {640, 
    3.44}};

set[1] = Cases[dataSet, {x_, y_} /; x < 423];
set[2] = Cases[dataSet2, {x_, y_} /; x < 263];
set[3] = Cases[dataSet2, {x_, y_} /; x > 264];


avgCurrent = 
 Integrate[
     Interpolation[dataSet, InterpolationOrder -> 1][x], {x, 
      dataSet[[1, 1]], dataSet[[-1, 1]]}]/(Subtract @@ 
      dataSet[[{-1, 1}, 1]]) // N // SetPrecision[#, 3] &
maxCurrent = MaximalBy[dataSet, Last][[1, 2]];
noPoints = Length[dataSet];
lifeTime = dataSet[[-1, 1]];

avgCurrent2 = 
 Integrate[
     Interpolation[dataSet2, InterpolationOrder -> 1][x], {x, 
      dataSet2[[1, 1]], dataSet2[[-1, 1]]}]/(Subtract @@ 
      dataSet2[[{-1, 1}, 1]]) // N // SetPrecision[#, 3] &
maxCurrent2 = MaximalBy[dataSet2, Last][[1, 2]];
noPoints2 = Length[dataSet2];
lifeTime2 = dataSet2[[-1, 1]];

ListLinePlot[{set[1]}, PlotRange -> {{0, 700}, {0, 6}}, 
 PlotStyle -> {Directive[RGBColor[0., 0.75, 0.85], 
    AbsoluteThickness[2.5]], {set[2], set[3], 
    PlotRange -> {{0, 700, {0, 5}, 
       PlotStyle -> {Directive[RGBColor[0.4, 0.5, 0.6], 
          AbsoluteThickness[2.5]]}}}}}, PlotTheme -> "Detailed", 
 Epilog -> {{Red, AbsolutePointSize[4], Point[dataSet]}, {Dashed, 
    Line[{{262, 3.91`}, {281, 1.26`}}]}, {Purple, 
    AbsolutePointSize[4], Point[dataSet2]}, 
   Inset[Framed[
     Grid[{{Style["Cathode 284 - Drilled", 
         Bold]}, {"Average Current: ", avgCurrent, 
        " \[Mu]A"}, {"Maximum Current: ", maxCurrent, 
        " \[Mu]A"}, {"Active Cathode Lifetime: ", lifeTime, 
        "minutes"}, {"Number of Data Points: ", noPoints}}], 
     Background -> White, RoundingRadius -> 5], Scaled[{.40, .85}]], 
   Inset[Framed[
     Grid[{{Style["Cathode 285 - Undrilled", Bold, 
         TextAlignment -> Center]}, {"Average Current: ", avgCurrent2,
         " \[Mu]A"}, {"Maximum Current: ", maxCurrent2, 
        " \[Mu]A"}, {"Active Cathode Lifetime: ", lifeTime2, 
        "minutes"}, {"Number of Data Points: ", noPoints2}}], 
     Background -> White, RoundingRadius -> 5], Scaled[{.80, .85}]]}, 
 PlotLabel -> 
  "Current Yield: Drilled Iron Cathode vs. Undrilled Iron Cathode", 
 PlotLegends -> 
  Placed[LineLegend[{"Iron (Cathode 284 - Drilled)", 
     "Iron (Cathode 285 - Undrilled)"}, 
    LegendFunction -> "Panel"], {0.80, 0.28}], 
 LabelStyle -> {Black, Bold}, Frame -> {{True, False}, {True, False}},
  FrameLabel -> {"Cathode Runtime (minutes)", "Current (\[Mu]A)"}, 
 ImageSize -> {550, 550}, InterpolationOrder -> 1]

The target is something like this (except with 2 lines): enter image description here

Currently, it outputs: enter image description here

$\endgroup$
2
  • 3
    $\begingroup$ Thanks for a clear description of your on-topic goal (✅) and the well formatted, easy to copy&paste, in Raw InputForm Wolfram Language code example (✅). You question would be easier to answer and more useful for future readers if it was a minimal working code example instead of that long piece of code with so many details irrelevant to the question. (❌) $\endgroup$
    – rhermans
    Commented Nov 3, 2022 at 16:52
  • 1
    $\begingroup$ Perhaps you want ListLinePlot[{set[1], set[2], set[3]},...]? $\endgroup$ Commented Nov 3, 2022 at 20:14

1 Answer 1

2
$\begingroup$

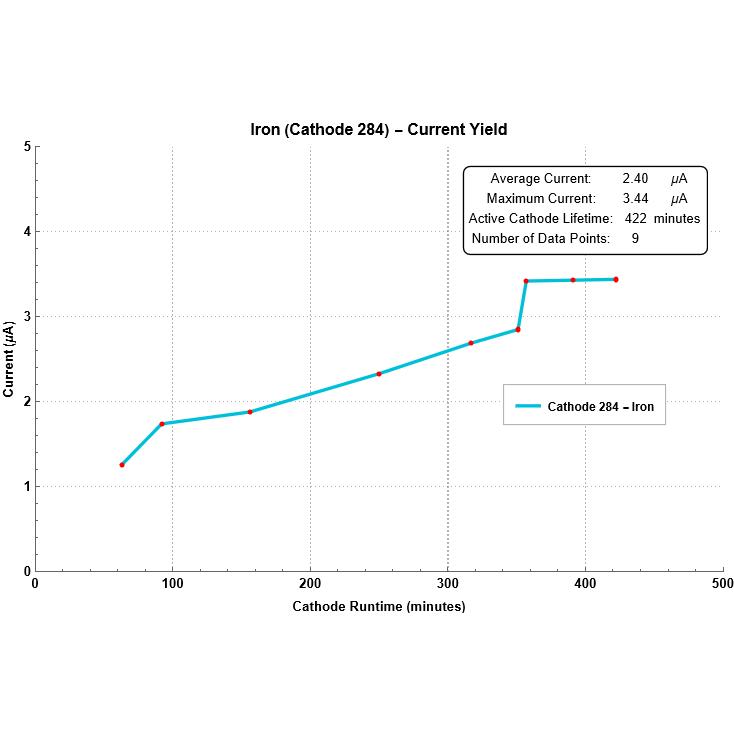
How's this:

ListLinePlot[{set[1], set[2], set[3]},
 PlotRange -> {{0, 700}, {0, 6}},
 PlotStyle -> {Directive[RGBColor[0.4, 0.5, 0.6], 
    AbsoluteThickness[2.5]],
   Directive[RGBColor[0.8, 0.5, 0.6], AbsoluteThickness[2.5]], 
   Directive[RGBColor[0.8, 0.5, 0.6], AbsoluteThickness[2.5]]},
 PlotTheme -> "Detailed",
 Epilog -> {
   {Red, AbsolutePointSize[4], Point[dataSet]}, {Dashed, 
    Line[{{262, 3.91`}, {281, 1.26`}}]},
   {Purple, AbsolutePointSize[4], Point[dataSet2]}, 
   Inset[Framed[
     Grid[{{Style["Cathode 284 - Drilled", 
         Bold]}, {"Average Current: ", avgCurrent, 
        " \[Mu]A"}, {"Maximum Current: ", maxCurrent, 
        " \[Mu]A"}, {"Active Cathode Lifetime: ", lifeTime, 
        "minutes"}, {"Number of Data Points: ", noPoints}}], 
     Background -> White, RoundingRadius -> 5], Scaled[{.40, .85}]], 
   Inset[Framed[
     Grid[{{Style["Cathode 285 - Undrilled", Bold, 
         TextAlignment -> Center]}, {"Average Current: ", avgCurrent2,
         " \[Mu]A"}, {"Maximum Current: ", maxCurrent2, 
        " \[Mu]A"}, {"Active Cathode Lifetime: ", lifeTime2, 
        "minutes"}, {"Number of Data Points: ", noPoints2}}], 
     Background -> White, RoundingRadius -> 5], Scaled[{.80, .85}]]}, 
 PlotLabel -> 
  "Current Yield: Drilled Iron Cathode vs. Undrilled Iron Cathode", 
 PlotLegends -> 
  Placed[LineLegend[{"Iron (Cathode 284 - Drilled)", 
     "Iron (Cathode 285 - Undrilled)"}, 
    LegendFunction -> "Panel"], {0.80, 0.28}], 
 LabelStyle -> {Black, Bold}, Frame -> {{True, False}, {True, False}},
  FrameLabel -> {"Cathode Runtime (minutes)", "Current (\[Mu]A)"}, 
 ImageSize -> {550, 550}, InterpolationOrder -> 1]
enter image description here

$\endgroup$
4
  • 1
    $\begingroup$ Line colors are incorrect. See my comment in the question. $\endgroup$ Commented Nov 3, 2022 at 21:41
  • $\begingroup$ Oh I see, just a minute... $\endgroup$ Commented Nov 3, 2022 at 22:03
  • $\begingroup$ There you go. Second and third plot style directives control the color of the second and third plot lines (undrilled). $\endgroup$ Commented Nov 3, 2022 at 22:10
  • 1
    $\begingroup$ This is perfect thank you. I wasn't too far off - still would've taken me days to spot what I did wrong $\endgroup$
    – Epideme
    Commented Nov 4, 2022 at 11:24

Your Answer

By clicking “Post Your Answer”, you agree to our terms of service and acknowledge you have read our privacy policy.

Not the answer you're looking for? Browse other questions tagged or ask your own question.