Milan, the easiest way to do it is by using Dynamic[].
Manipulate[SeedRandom[seed];
meanvector := Mean[assets];
assets = Table[RandomFunction[GeometricBrownianMotionProcess[\[Mu]Table[RandomFunction[GeometricBrownianMotionProcess[μ, \[Sigma]σ, S0], {0, time, 0.1}]["Path"], {P}];
processes = Transpose[assets[[#]]][[2]] & /@ Range@Length[assets];
processesposition=Flatten[Position[Min[processes[[#]]]&/@Range@Length[assets], _?(# > watermark &)]];
watermarkedassets = assets[[#]] & /@ processesposition;
watermarkedmeanvector = Mean[watermarkedassets];
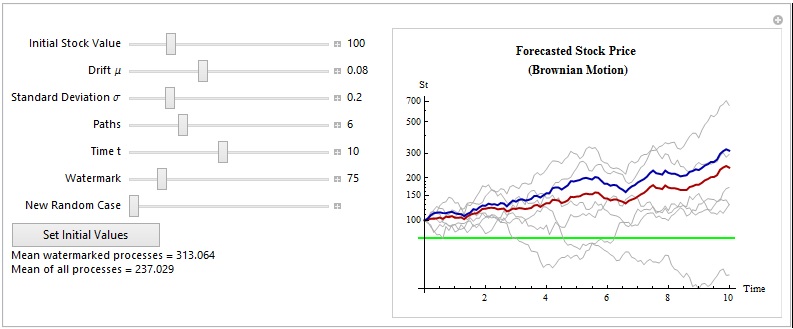
G1 := ListLogPlot[assets, GridLines -> {{}, {watermark}},GridLinesStyle -> Directive[Green, Thick], Joined -> True, AxesLabel -> {"Time", "St"}, PlotLabel -> Style["Forecasted Stock Price\n (Brownian Motion)", Bold], PlotRange -> All, PlotStyle -> Directive[{Thin, Lighter@Gray}]];
G2 := ListLogPlot[{meanvector, watermarkedmeanvector},Joined -> True, PlotStyle -> {Directive[{Thick, Darker@Red}], Directive[{Thick, Darker@Blue}]}];
Show[G1, G2],
{{S0, 100, "Initial Stock Value"}, 1, 500, 0.5, Appearance -> "Labeled"},
{{\[Mu]μ, 0.08, "Drift \[Mu]"μ"}, 0.01, 0.2, 0.01, Appearance -> "Labeled"},
{{\[Sigma]σ, 0.2, "Standard Deviation \[Sigma]"σ"}, 0.01, 1, 0.05, Appearance -> "Labeled"},
{{P, 6, "Paths"}, 1, 20, 1, Appearance -> "Labeled"},
{{time, 10, "Time t"}, 1, 20, 1, Appearance -> "Labeled"},
{{watermark, 75, "Watermark"}, 1, 500, Appearance -> "Labeled"},
{{seed, 1, "New Random Case"}, 1, 100, 1},
Button["Set Initial Values", {S0 = 100, \[Mu]μ = 0.08, \[Sigma]σ = 0.20, P = 6, time = 10, watermark = 75}, ImageSize -> 150],
Dynamic["Mean watermarked processes = "<>ToString[watermarkedmeanvector[[-1]][[2]]]],
Dynamic["Mean of all processes = "<>ToString[meanvector[[-1]][[2]]]],
ControlPlacement -> Left]

