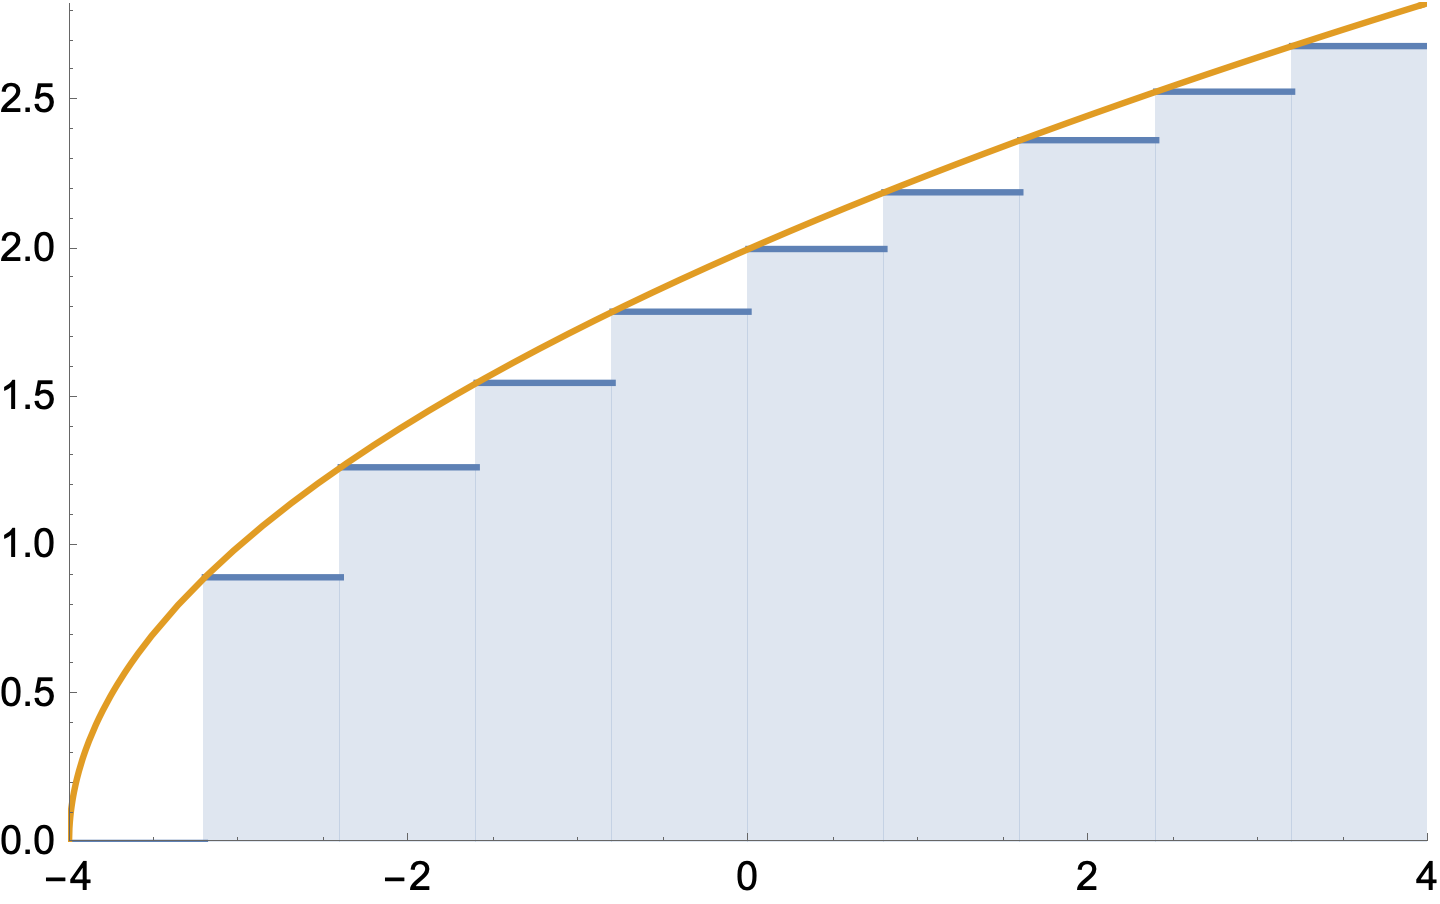
- Using Mathematica create a single graph that plots both the function
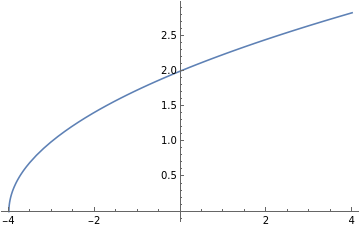
a)$f(x)=\sqrt(x+4)$ on the domain $-4\leq x \leq4$
b) A visualization of a left-hand Riemann sum with 10 rectangles
Here is my code so far:
a=-4;
b=4;
n=10;
DX=(b-a)/n;
f[x_]:=Sqrt[x+4];
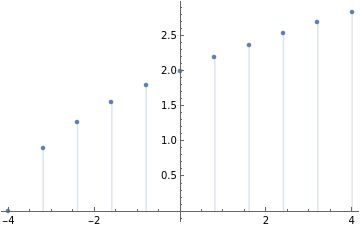
DiscretePlot[{f[x]},{x,-4,4,(4/5)}]
Plot[f[x],{x,-4,4}]
What I want to do is to plot on one single graph, the function f(x) and my 10 rectangles. I do not know what functions to use. Thank you


