3
$\begingroup$

I'm a newbie in Mathematica. I'm trying to solve for two functions (best-response functions in a simple game), and then to plot the functions on the same graph. One function is p1 = resp1(p2) and the other is p2 = resp2(p1). I'd like to plot them both such that p1 is the x-axis and p2 is on the y-axis. The goal is that I'd like to be able to alter the form of q1 and q2 and easily see how the shape of the best-responses functions change and how many equilibria exist (the intersections of the best responses).

q1 = A - a*p1 + c*CDF[GammaDistribution[α, β], p2];
q2 = B - b*p2 + c*CDF[GammaDistribution[α, β], p1];
r1 = (p1 - mc)*q1;
r2 = (p2 - mc)*q2;
BR1t = FullSimplify[Solve[ D[r1, p1] == 0, p1, Reals],Assumptions -> {p2 > 0, p1 > 0}];
BR2t = FullSimplify[Solve[ D[r2, p2] == 0, p2, Reals],Assumptions -> {p1 > 0, p2 > 0}];
A = 100; B = 100; a = 1;  b = 1; c = 30; mc = 1;
α= 4; β = 2; 
resp1 = p1 /. First[BR1t]
resp2 = p2 /. First[BR2t]

g1 = Plot[resp1, {p2, 1, 100}]
g2 = Plot[resp2, {p1, 1, 100}]

I'm not sure what comes next in terms of creating the single plot.... any help would be appreciated.

Thank you.

$\endgroup$
6
  • $\begingroup$ You've seen ParametricPlot[]? $\endgroup$ Commented Aug 2, 2012 at 14:40
  • $\begingroup$ Did you try Plot[resp2 /. p1 -> resp1, {p1, 0, 10}]? $\endgroup$ Commented Aug 2, 2012 at 14:57
  • $\begingroup$ You need to add @ characters to the names of commenters you want to ping (I added the one at J.M). The system also allows only one ping per comment, so the comment above won't reach @belisarius (but this one will). $\endgroup$ Commented Aug 2, 2012 at 15:13
  • $\begingroup$ By the way: welcome to Mathematica.SE! Please consider registering your account. This will enable you to comment below other people's questions and answers and will keep track of reputation you gain from question and answers. $\endgroup$ Commented Aug 2, 2012 at 15:14
  • $\begingroup$ @belisarius - I sort of see where you're going, but the resulting plot is still the same shape. I want to have the two plots on the same graph with the appropriate axes. Since resp1: p2-->p1 and resp2: p1-->p2, and I want p1 on the x-axis, I need to invert the plot for resp1. Does this clarify at all? $\endgroup$ Commented Aug 2, 2012 at 15:17

2 Answers 2

3
$\begingroup$

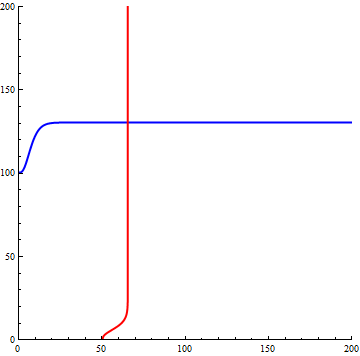
You can also use a single ParametricPlot with two datasets:

bresp1[x_] := 201/2 + 30 GammaRegularized[4, 0, x/2];
bresp2[x_] := 1/2 (101 + 30 GammaRegularized[4, 0, x/2]);
ParametricPlot[{{x, bresp1[x]}, {bresp2[x], x}}, {x, 0, 200}, 
PlotStyle -> {{Blue, Thick}, {Red, Thick}}, 
PlotRange -> {{0, 200}, {0, 200}}, AspectRatio -> 1]

enter image description here

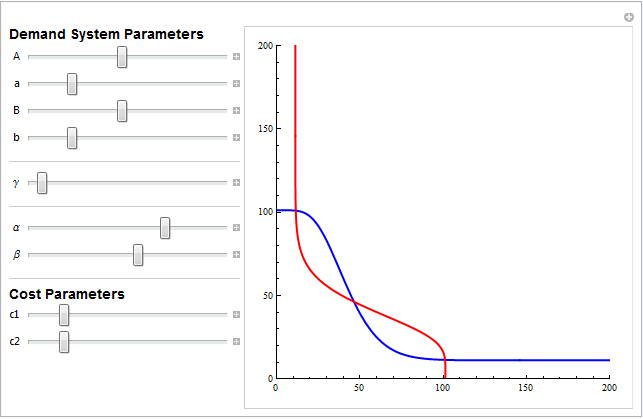
EDIT: Manipulate with all model parameters:

br[A_?NumericQ, a_?NumericQ, \[Gamma]_?NumericQ, \[Alpha]_?NumericQ, \[Beta]_?  NumericQ, c_?NumericQ, x_?NumericQ] := 
( a c + A + \[Gamma] GammaRegularized[\[Alpha], 0, x/\[Beta]])/(2 a)
Manipulate[ ParametricPlot[{{x, br[A, a, \[Gamma], \[Alpha], \[Beta], c1, x]}, 
{br[B,  b, \[Gamma], \[Alpha], \[Beta], c2, x], x}}, {x, 0, 200}, 
PlotStyle -> {{Blue, Thick}, {Red, Thick}}, 
PlotRange -> {{0, 200}, {0, 200}}, AspectRatio -> 1], 
Style["Demand System Parameters", "Subsection"], 
{{A, 100, "A"}, 10, 200, 10}, {{a, .5, "a"}, .1, 2, .1}, 
{{B, 100, "B"}, 10, 200, 10}, {{b, .5, "b"}, .1, 2, .1}, Delimiter,
{{\[Gamma], -50, "\[Gamma]"}, -100, 100, 5}, Delimiter, 
{{\[Alpha], 6, "\[Alpha]"}, 1, 10, .1},
{{\[Beta], 6, "\[Beta]"}, 1, 10, .1}, Delimiter, 
Style["Cost Parameters", "Subsection"], 
{{c1, 5, "c1"}, 0, 15, .1}, {{c2, 5, "c2"}, 0, 15, .1}
ControlPlacement -> Left]

enter image description here

$\endgroup$
2
  • $\begingroup$ Thanks, @kguler! Very helpful to be able to manipulate all the parameters. It seems like you've done this before? If so, do you happen to know, off the top of your help, any good functional forms that lead to multiple equilibria like the above? Specifically, we're looking for multiple equilibria where prices are more symmetric across firms, such as a (low, low) and (high, high) pair of equilibria (with an unstable one in the middle). I can get that with this parameterization, but any other recommendations would be appreciated. $\endgroup$ Commented Aug 2, 2012 at 18:55
  • $\begingroup$ I am not a microeconomist so I haven't worked on such things lately, but the non-convexity isn't needed. I was able to get a triple equilibria with this pair of functions: Plot[{Exp[-x - 0.25] + 0.1, Exp[-(0.9 x^(1/2))]}, {x, -1, 12}, PlotRange -> {0, 2}]. Their derivatives need to be equal at two points, so what you are looking for is convex functions (first derivative negative, second derivative positive) where the second derivative crosses. $\endgroup$
    – Verbeia
    Commented Aug 3, 2012 at 5:59
1
$\begingroup$

Basically, what you want to do is to swap the axes for one of the two plots. Usually the best way to do this is with ParametricPlot. Try this code to get a flavour of how it works:

plot1 = Plot[x^2, {x, 0, 2}, AspectRatio -> 1]
plot2 = ParametricPlot[{x^2, x}, {x, 0, 2}, AspectRatio -> 1]
Show[plot1, plot2]

With your example above, the code would be

nullPlot = Plot[Null, {x, 1, 100}, PlotRange -> {1, 100}, AspectRatio -> 1];
g1 = Plot[resp1, {p2, 1, 100}];
g2 = ParametricPlot[{resp2, p1}, {p1, 1, 100}];
Show[nullPlot, g1, g2]

the first line of which creates an empty set of axes with the relevant x,y ranges.

Also, if you want to see how your parameters affect the equilibrium you can use something like

Manipulate[
    plot1 = Plot[a*x^2, {x, 0, 2}, AspectRatio -> 1, PlotRange -> {0, 2}]; 
    plot2 = ParametricPlot[{a*x^2, x}, {x, 0, 2}, AspectRatio -> 1]; 
    Show[plot1, plot2], {a, 1, 2}]
$\endgroup$
1
  • $\begingroup$ thanks for the response, very helpful. However, one problem. I'm trying the code below. When I define g2 earlier, then I see something plotted, but it doesn't change as I vary the plot. Thus, I deleted the definition of g2, but then I don't see anything plotted. Any ideas? (I've renamed alpha to g1 and beta to g2) Manipulate[plot1 = Plot[resp2, {p1, 10, 100}, AspectRatio -> 1, PlotRange -> {10, 100}] ; plot2 = ParametricPlot[{resp1 /. p2 -> resp2, p1}, {p1, 10, 100}, AspectRatio -> 1]; Show[plot1, plot2], {g2, 5, 9}] $\endgroup$ Commented Aug 2, 2012 at 15:55

Your Answer

By clicking “Post Your Answer”, you agree to our terms of service and acknowledge you have read our privacy policy.

Not the answer you're looking for? Browse other questions tagged or ask your own question.