1
$\begingroup$

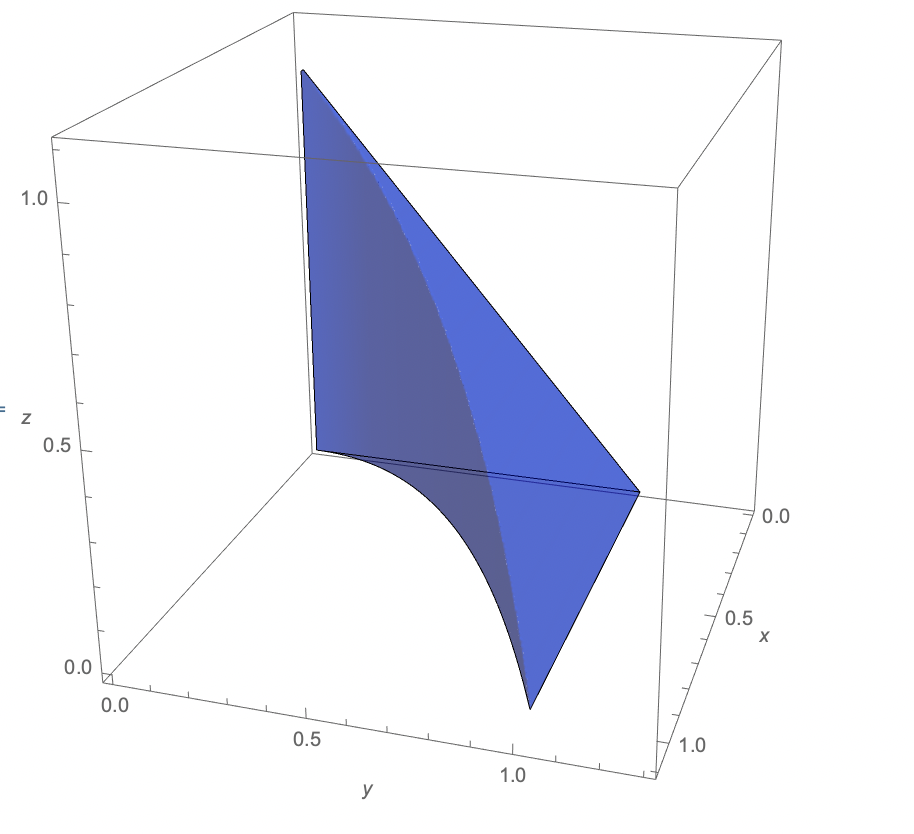
I was given an assignment which is to plot the same shape as the one in the link. https://i.sstatic.net/PAHMO.png

The shape is comprised of 2 functions: $z = 1 - y$ (1), $y = \sqrt{x}$ (2) and $z = 0$. I tried using Mathematica for the first time and got a successful result with function (1), but function (2) doesn't seem to work as I expected. I tried the command

 Plot3D[y == Sqrt[x] , {x, 0, 1}, {y, 0, 1}, AxesLabel -> {x, y, z}, AxesOrigin -> {0, 0, 0}, Boxed -> False]

and received: enter image description here I know it doesn't make sense at all, since I think the program only plots $z=f(x,y)$ correctly, not $y = f(x)$ or even $y=f(x,z)$. Somehow online tools such as https://www.monroecc.edu/faculty/paulseeburger/calcnsf/CalcPlot3D/ got this worked out perfectly.
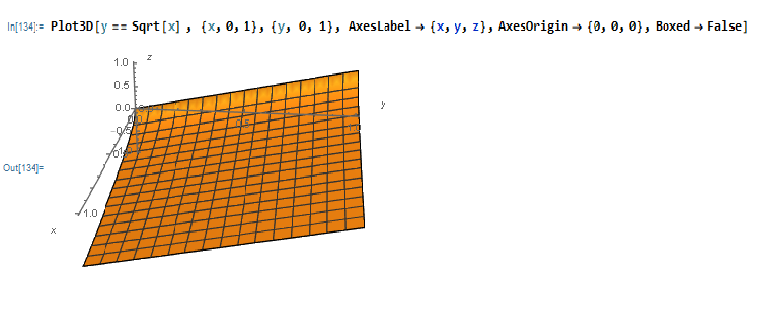
enter image description here

Right now I'm stuck and I have been trying my best to find a solution. I post the problem here and hopefully I can receive all the help available.

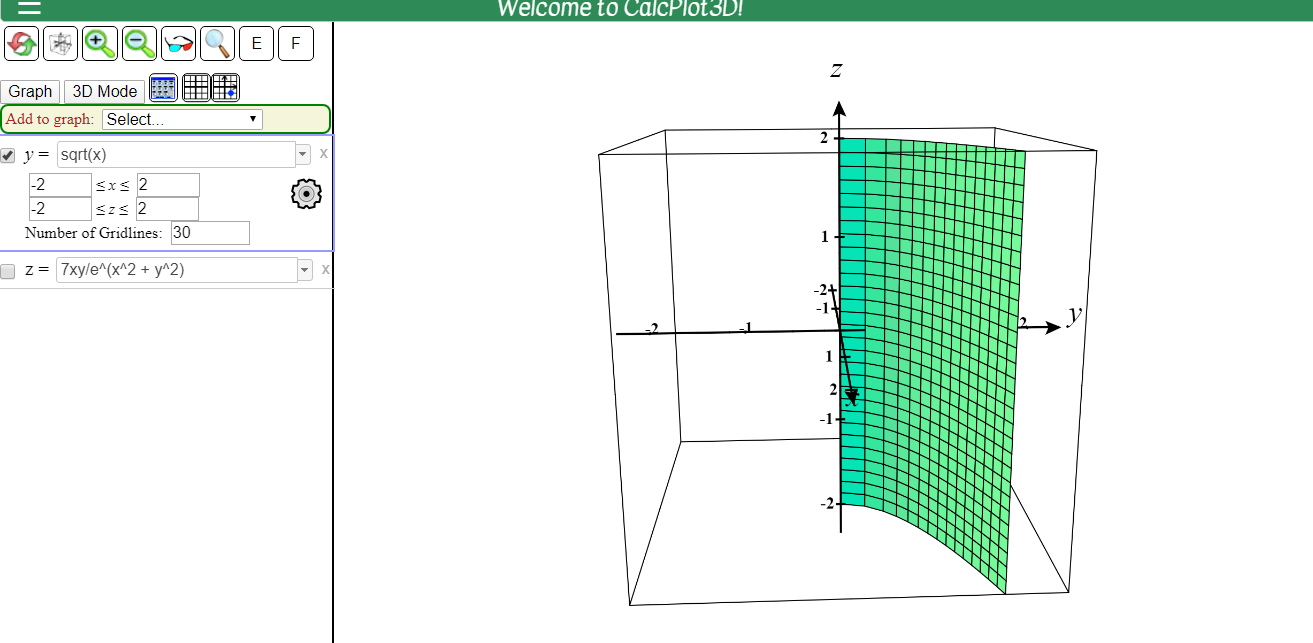
$\endgroup$
0

2 Answers 2

1
$\begingroup$

You need to use RegionPlot3D

Clear[x, y, z]
RegionPlot3D[{x < 1 && y < 1 && z < 1 && z < 1 - y && 
   y > (x)^(1/2)}, {x, 0, 1.1}, {y, 0, 1.3}, {z, 0, 1.1}, 
 PlotStyle -> {Blue, Opacity[0.4]}, Mesh -> None, 
 AxesLabel -> Automatic, PlotPoints -> 200]

enter image description here

$\endgroup$
1
  • $\begingroup$ Thanks a lot for your answer! I'm new to this software so can you please explain to me why we have to add x < 1 && y < 1 && z < 1 to the command? $\endgroup$ Commented Apr 21, 2020 at 1:47
1
$\begingroup$

Use ContourPlot3D or ParametricPlot3D to Plot y == Sqrt[x].

ContourPlot3D[y == Sqrt[x], {x, 0, 1.2}, {y, 0, 1.2}, {z, 0, 1.2}, ViewPoint -> {3.2, -0.13, 1.0}]

Or

ParametricPlot3D[{x, y, z} /. y -> Sqrt[x], {x, 0, 1.2}, {z, 0, 1.2}, 
 ViewPoint -> {3.2, -0.13, 1.0}]

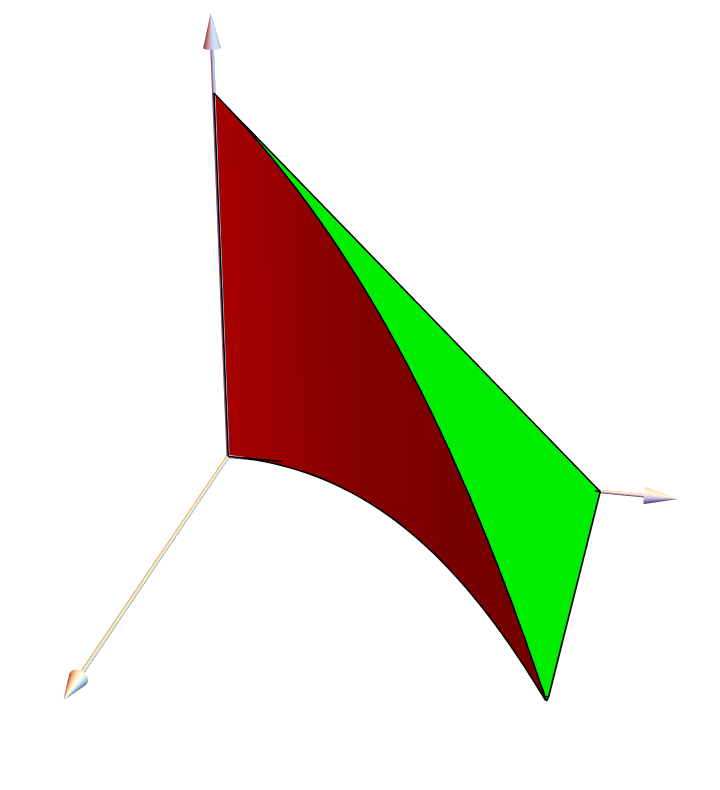
Besides RegionPlot3D, we can also use RegionFunction to cut the surfaces and then Show the elements.

Here is an attempt.

SetOptions[ContourPlot3D, RegionBoundaryStyle -> None, 
  AxesLabel -> {x, y, z}, ViewPoint -> {3.02, 0.64, 1.30}, 
  Mesh -> None, Boxed -> False, Axes -> False];
surf1 = ContourPlot3D[
   y == Sqrt[x], {x, 0, 1.2}, {y, 0, 1.2}, {z, 0, 1.2}, 
   RegionFunction -> Function[{x, y, z}, z <= 1 - y], 
   ContourStyle -> Red];
surf2 = ContourPlot3D[
   z == 1 - y, {x, 0, 1.2}, {y, 0, 1.2}, {z, 0, 1.2}, 
   RegionFunction -> Function[{x, y, z}, y >= Sqrt[x]], 
   ContourStyle -> Green];
surf3 = ContourPlot3D[z == 0, {x, 0, 1.2}, {y, 0, 1.2}, {z, 0, 1.2}, 
   RegionFunction -> Function[{x, y, z}, y >= Sqrt[x] && z <= 1 - y ],
    ContourStyle -> Blue];
surf4 = ContourPlot3D[x == 0, {x, 0, 1.2}, {y, 0, 1.2}, {z, 0, 1.2}, 
   RegionFunction -> Function[{x, y, z}, z <= 1 - y ], 
   ContourStyle -> Yellow];
axes = Graphics3D[{Arrow@*
      Tube /@ {{{0, 0, 0}, {1.2, 0, 0}}, {{0, 0, 0}, {0, 1.2, 
        0}}, {{0, 0, 0}, {0, 0, 1.2}}}}];
Show[surf1, surf2, surf3, surf4, axes]

enter image description here

$\endgroup$

Your Answer

By clicking “Post Your Answer”, you agree to our terms of service and acknowledge you have read our privacy policy.

Not the answer you're looking for? Browse other questions tagged or ask your own question.