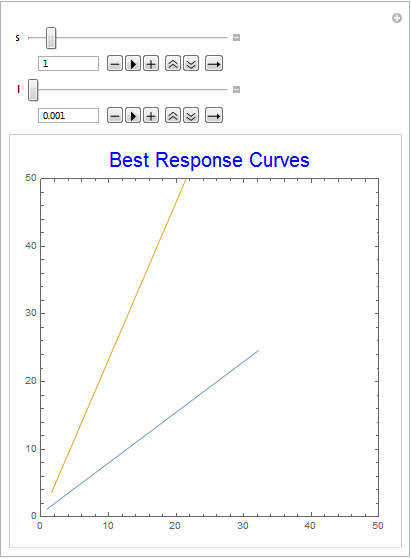
I have two best response functions that I have defined like this:
BRc[p_, s_, l_] := (3 p + 2 s + 4 l p s + 4 l s^2)/(4 (1 + 2 l s));
BRp[c_, s_, l_] := (-(c/s) - c/(s (2 + 4 l s)))/(
  1/(2 (1 + 2 l s)^2) - 2/(1 + 2 l s) - 2/(s (1 + 2 l s)));
I want to define certain ranges, values and add a title for the plot, like this:
Manipulate[
 ParametricPlot[{{p, BRc[p, s, l]}, {BRp[c, s, l], c}}, {c, 0,
   50}, {p, 0, 50}, PlotStyle -> {{Blue, Thick}, {Red, Thick}},
  PlotRange -> {{0, 50}, {0, 50}}, AxesLabel -> {c, p},
  AspectRatio -> 1,
  PlotLabel -> Style["Best Response Curves", Blue, 20]],
 Style["Parameters", Bold, Medium], {s, 0, 10}, {l, 0, 10}]
But I need to define the following restrictions inside Manipulate[ ]:
p > 0 && ((0 < l < 1/
      2 && ((p < c < p/(2 l) &&
         0 < s < (-2 c + p)/(4 c l - 2 p)) || (c >= p/(2 l) &&
         s > 0))) || (1/2 <= l <= 1 && c > p && s > 0))
To make sure that the two functions always intersect.
I don't know where to insert the restrictions. Help needed here. Also I would like to name the axis
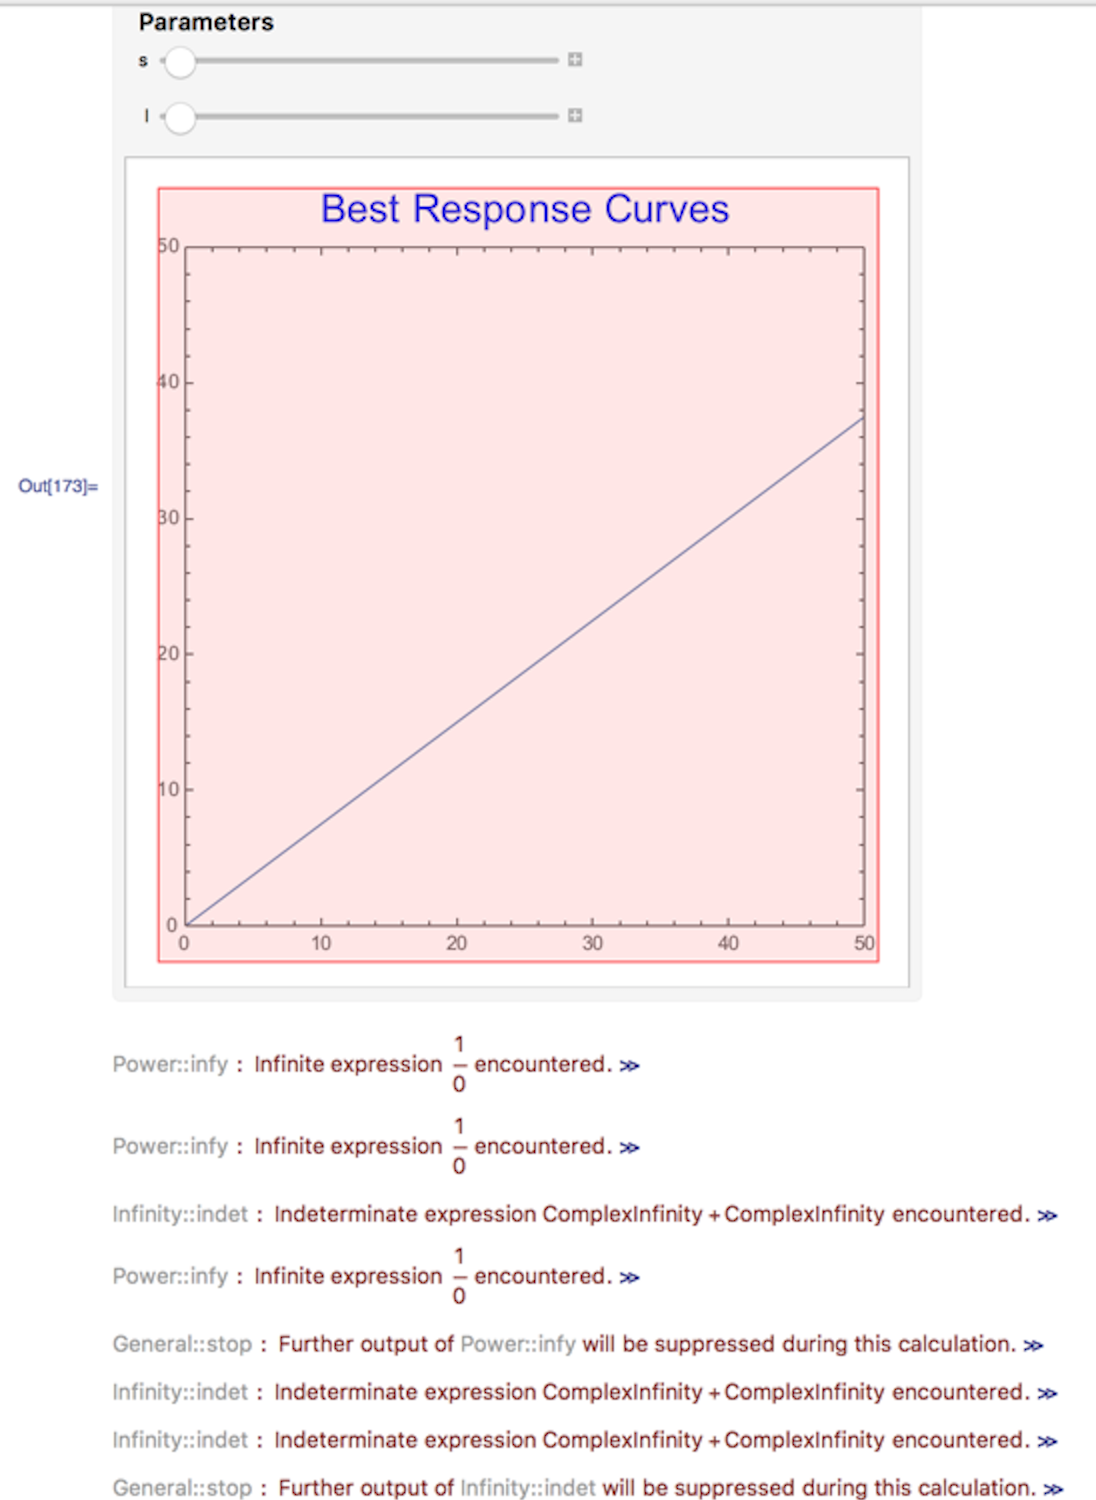
When I run the code without these restrictions, I get the following image/error:


FrameLabelinstead ofAxesLabel. $\endgroup$FrameLabelworked. Thx! $\endgroup$