I have two functions f[x,y,z,a,b] and g[x,y,z,a,b], where the variables are restricted to a set of values: x $\in$ [x0, x1], y $\in$ [y0, y1], z $\in$ [z0, z1], a $\in$ [a0, a1], b $\in$ [b0, b1]. I can find the minimum and maximum values within the restrictions using Minimize and Maximize.
These two functions are the X and Y coordinates of a point, I am using them to show some paths using ParametricPlot and to draw graphics using Graphics. The thing is, I need to know the boundaries which define the possible locations of the point.
How could I find the contour of the area for which the (X,Y) plot of these two functions is defined?
EDIT1:
I have tried to do it in two different ways.
1.
Using ParametricRegion:
R = ParametricRegion[{Xt[X2, Th3, La1, La2, La3, La4, La5] /. {X2 -> X2in, La3 -> La3in} /. {Th3 -> Th3in, La4 -> La4in, La5 -> La5in}, Yt[X2, Th3, La1, La2, La3, La4, La5] /. {X2 -> X2in, La3 -> La3in} /. {Th3 -> Th3in, La4 -> La4in, La5 -> La5in}}, {{La1, dA1min, dA1max}, {La2, dA2min, dA2max}}];
And trying to represent it by:
Region[R]
This is not able to give a result (it is still running after about 10h and 8GB of RAM).
2.
Using ParametricPlot
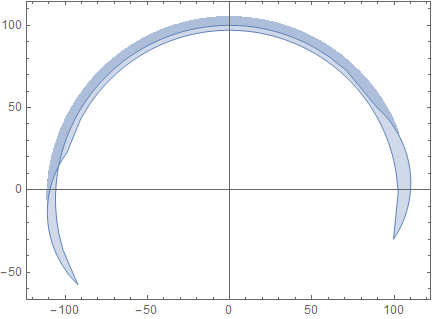
ParametricPlot[{{Xt[X2, Th3, La1, La2, La3, La4, La5], Yt[X2, Th3, La1, La2, La3, La4, La5]}} /. {X2 -> X2min, Th3 -> Th3min, La3 -> dA3min, La4 -> dA4min, La5 -> dA5min}, {La1, dA1min, dA1max}, {La2, dA2min, dA2max}, AspectRatio -> Automatic]
This is able to give a result relatively fast (40s and <2GB of RAM).

But unfortunately, ParametricPlot can't plot regions depending on more than 2 variables.
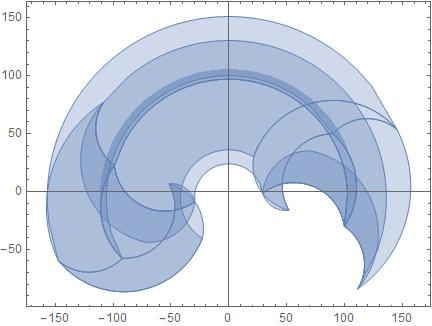
Just to give some insight into the problem, (Xt, Yt) give the position of a point from a body in a machine. I need to obtain the 'range of action' of this point. I need to find the contour of the area (or the area itself) in which the point can be located. The problem is that the point depends on 5 (6) variables.


ParametricRegionis the way to go but hard to say without example. Maybe it will take more time than to generate point cloud for random point from the domain. $\endgroup$ParametricRegion, but it takes an awful lot of time to give the results with 2/5 variables. Any other suggestions? $\endgroup$ParametricPlotwith 2 variables is much faster thanParametricRegionwith the same 2 variables. $\endgroup$