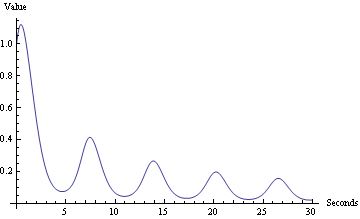
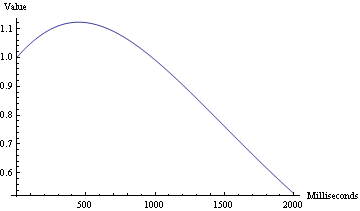
I'm wondering how I can change the units of the x (time) axis when plotting a solution from NDSolve. I have obtained three solutions to a system of differential equations, all of which exist over the time scale [0 s, 1 ms]. However, I'm really only interested in the range [0 s, 5 ns].
To avoid having (x 10^-9) appended to every value along the x-axis when I plot these three functions (since the equations are solved in terms of seconds, not nanoseconds), I'd like to somehow scale the time axis to read 0, 1, 2, 3 ... (ns). It's fairly easy when working with symbolically specified functions- just multiply t by some constant wherever it appears in the function. However, this isn't possible here, since the solutions to the system are interpolated functions returned by NDSolve. Is there any efficient way to achieve this?


