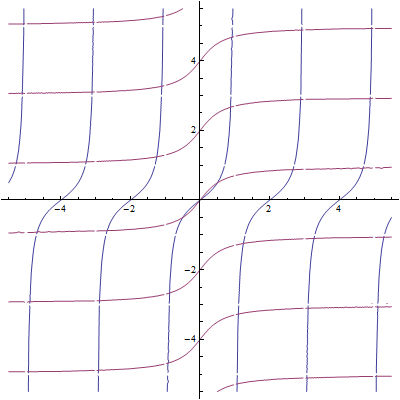
There are other solutions, this is correct. ContourPlot gives an idea:
ContourPlot[{
  -.5 Tan[.5 Pi x] + y == 0,
  -.5 Tan[.5 Pi y] + x == 0}, {x, -5.5, 5.5}, {y, -5.5, 5.5},
 PlotPoints -> 20,
 Frame -> False, Axes -> True,
 Exclusions -> Join[
   Table[{x == i}, {i, -5, 5, 2}],
   Table[{y == i}, {i, -5, 5, 2}]]]

Exclusions prevents drawing of asymptotes and poles. This plot can tell you where to search for roots. (Note also that you don't have to type * for multiplication, pressing space instead achieves the same effect.) Now use FindRoot for example with starting values you read off the plot (select plot > right click > Get Coordinates). Click some points close to intersections and Ctrl + C copy them. Let's say these thriteen pasted and assigned to start:
start = {{-1.279, 1.279}, {0.9913, 2.543}, {3.002, 2.773}, {2.6,
    0.9913}, {1.336, -1.307}, {-0.4166, -0.589}, {-0.1006,
    0.1006}, {0.5603,
    0.5603}, {-2.543, -1.02}, {-0.9913, -2.83}, {-3.031, -2.686}, \
{1.164, -3.405}, {3.175, -1.192}};
Length@start
(* 13 *)
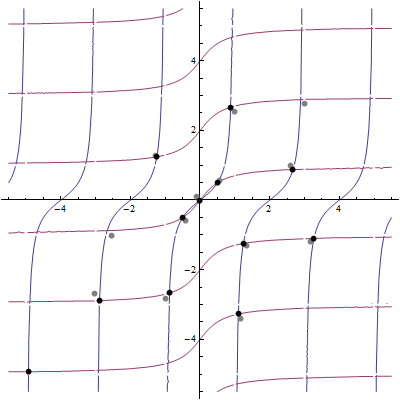
I visualize solution points with the same ContourPlot command to which I added Epilog overdraw specification (black points). You can see that not every starting point (gray) converged to a desired destination. Perhaps I should've start-clicked more carefully, or one could tell FindRoot to search differently, you'd have to consult help on that.
sol = Map[Function[ini,
   With[{x0 = First@ini, y0 = Last@ini},
    {x, y} /. FindRoot[{
       -.5 Tan[.5 Pi x] + y == 0,
       -.5 Tan[.5 Pi y] + x == 0}, {{x, x0}, {y, y0}}]]], start];


FindRoot[]orFindAllCrossings2D[]. $\endgroup$Reducemay run. $\endgroup$Solve[{0 == y - 1/2 Tan[(\[Pi] x)/2], 0 == x - 1/2 Tan[(\[Pi] y)/2], -10 <= x <= 10, -10 <= y <= 10}, {x, y}]$\endgroup$