1
$\begingroup$

I'm trying to find the solution set of {x, y} variables for the following system of equations:

Solve[{0 == -1/2*Tan[Pi*x/2] + y, 0 == -1/2*Tan[Pi*y/2] + x}, {x, y}]

But when I try this, I can't get a result. Is there another function I should use? I can get the "basic" solutions by hand noting that if $x = 0$, then $y = 2n$ where $n$ is an integer (and vice-versa for when $y = 0$). But I think there are other solutions...

Any help would be appreciated, thanks!

I'm using Mathematica 8, BTW.

$\endgroup$
4
  • $\begingroup$ What you have there is a system of transcendental equations that are difficult to solve in general. If you don't mind approximate solutions, you can use FindRoot[] or FindAllCrossings2D[]. $\endgroup$ Commented May 18, 2013 at 16:54
  • $\begingroup$ Or plot the two functions and see where they cross... that will tell you if you should expect to find answers. $\endgroup$
    – bill s
    Commented May 18, 2013 at 16:58
  • $\begingroup$ i dont know exactly but, the command Reduce may run. $\endgroup$
    – MATIRMAK
    Commented May 18, 2013 at 16:59
  • 2
    $\begingroup$ Can get a result if you restrict the space, e.g. try Solve[{0 == y - 1/2 Tan[(\[Pi] x)/2], 0 == x - 1/2 Tan[(\[Pi] y)/2], -10 <= x <= 10, -10 <= y <= 10}, {x, y}] $\endgroup$ Commented May 18, 2013 at 20:48

1 Answer 1

2
$\begingroup$

There are other solutions, this is correct. ContourPlot gives an idea:

ContourPlot[{
  -.5 Tan[.5 Pi x] + y == 0,
  -.5 Tan[.5 Pi y] + x == 0}, {x, -5.5, 5.5}, {y, -5.5, 5.5},
 PlotPoints -> 20,
 Frame -> False, Axes -> True,
 Exclusions -> Join[
   Table[{x == i}, {i, -5, 5, 2}],
   Table[{y == i}, {i, -5, 5, 2}]]]
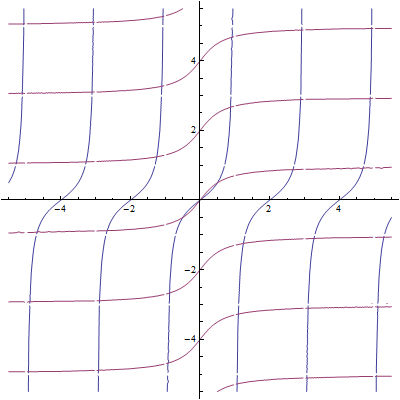
contourplot

Exclusions prevents drawing of asymptotes and poles. This plot can tell you where to search for roots. (Note also that you don't have to type * for multiplication, pressing space instead achieves the same effect.) Now use FindRoot for example with starting values you read off the plot (select plot > right click > Get Coordinates). Click some points close to intersections and Ctrl + C copy them. Let's say these thriteen pasted and assigned to start:

start = {{-1.279, 1.279}, {0.9913, 2.543}, {3.002, 2.773}, {2.6, 
    0.9913}, {1.336, -1.307}, {-0.4166, -0.589}, {-0.1006, 
    0.1006}, {0.5603, 
    0.5603}, {-2.543, -1.02}, {-0.9913, -2.83}, {-3.031, -2.686}, \
{1.164, -3.405}, {3.175, -1.192}};
Length@start
(* 13 *)

I visualize solution points with the same ContourPlot command to which I added Epilog overdraw specification (black points). You can see that not every starting point (gray) converged to a desired destination. Perhaps I should've start-clicked more carefully, or one could tell FindRoot to search differently, you'd have to consult help on that.

sol = Map[Function[ini,
   With[{x0 = First@ini, y0 = Last@ini},
    {x, y} /. FindRoot[{
       -.5 Tan[.5 Pi x] + y == 0,
       -.5 Tan[.5 Pi y] + x == 0}, {{x, x0}, {y, y0}}]]], start];
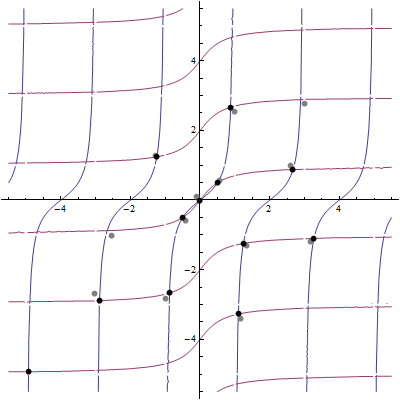
contourplot2

$\endgroup$
4
  • $\begingroup$ ...and FindAllCrossings2D[] is effectively a mechanical implementation of your approach. $\endgroup$ Commented May 18, 2013 at 18:11
  • $\begingroup$ @J.M. Yes, that's a truly great post and discussion. Should a beginner be pointed to a post like that however, it could scare him s******* easily, no? $\endgroup$
    – BoLe
    Commented May 18, 2013 at 18:18
  • $\begingroup$ Well, he can just copy the code and turn it loose on his equations... ;) $\endgroup$ Commented May 18, 2013 at 18:20
  • $\begingroup$ Amazing... thank you! $\endgroup$
    – Jon
    Commented May 18, 2013 at 19:58

Your Answer

By clicking “Post Your Answer”, you agree to our terms of service and acknowledge you have read our privacy policy.

Not the answer you're looking for? Browse other questions tagged or ask your own question.