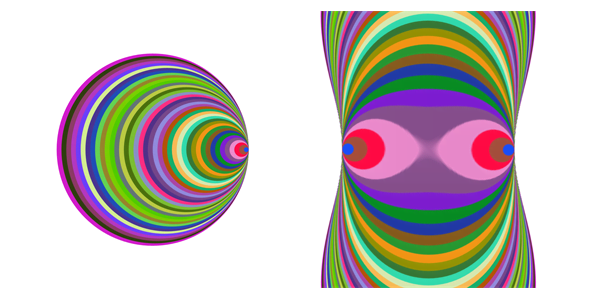
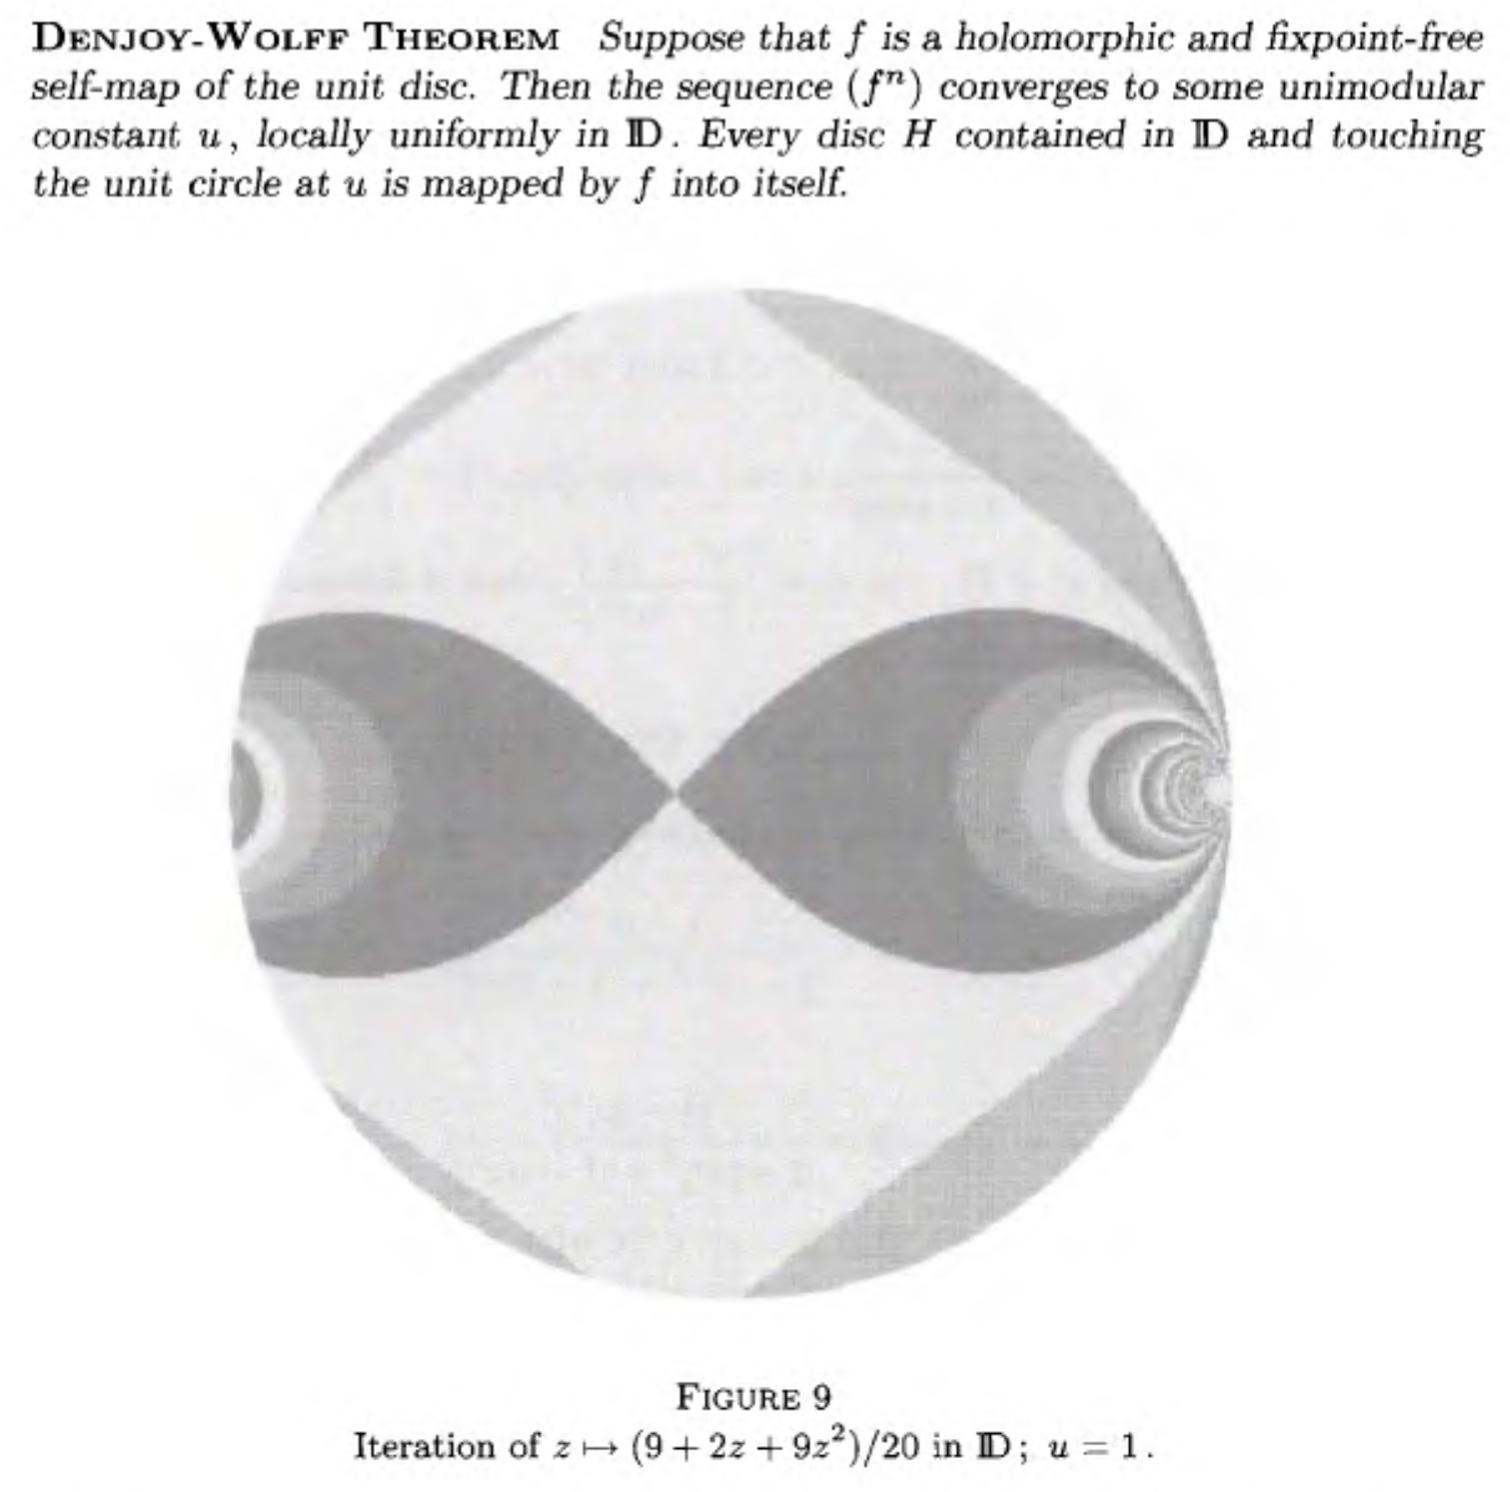
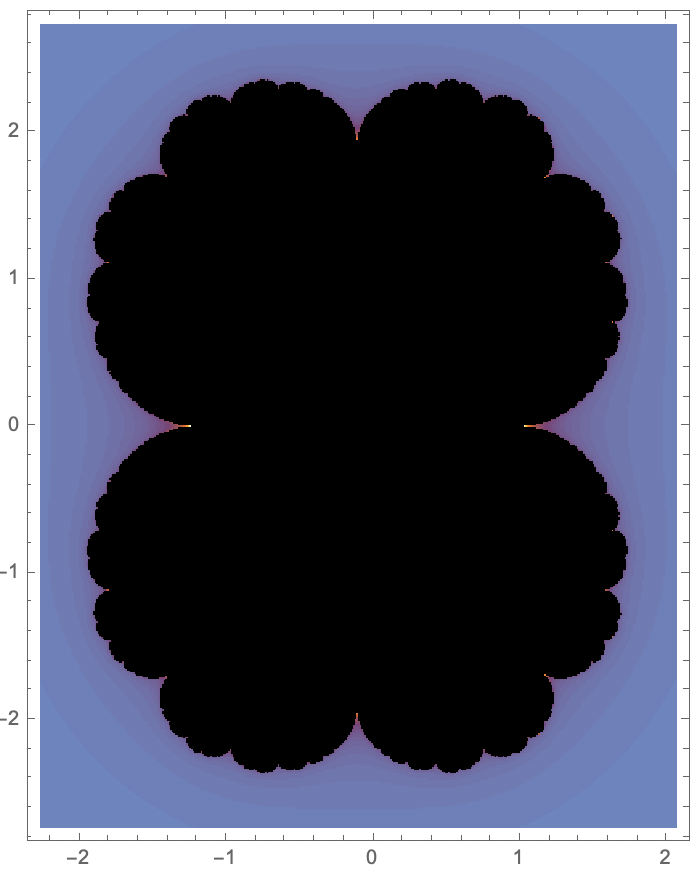
The theorem is talking about disks and you've plotted a Julia set which doesn't involve transforming any disks, but instead iterates at every point and testing if that point reaches the escape radius. I might not be reading it correctly, but it looks like the image is an iterated conformal map of some initial configuration of disks that touch the unit circle at a point.
This is a bit of a rough answer that cheats a bit by converting to an image and uses WFR function "ComplexTransformImage" to do the heavy lifting. Hopefully somebody can improve upon it, but it looks a bit more like your picture at least:
(* Start by generating the disks and creating an image *)
SeedRandom[1];
img = Rasterize[Graphics[
   Table[{RandomColor[], Disk[{u, 0}, 1 - u]}, {u, 0, 1, .025}]
   , ImagePadding -> 50], RasterSize -> 1024]

(* Apply the conformal map to the image *)
f[{x_, y_}] := With[{z = x + y I}, (9 + 2 z + 9 z^2)/20]
ResourceFunction["ComplexTransformImage"][img, f, 0.8, 1]

The left image is the initial configuration of disks, and the right is what you get after applying the map once with a range setting of 0.8.


