8
$\begingroup$

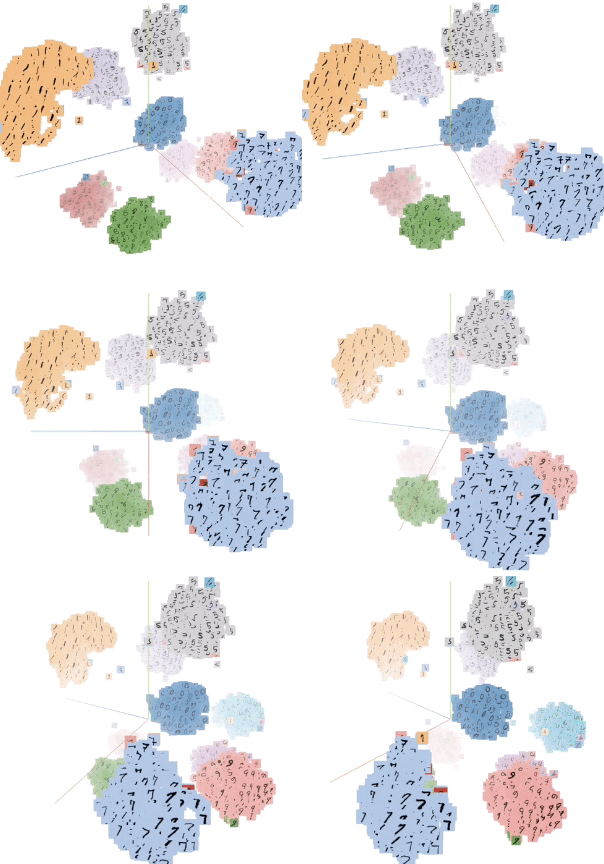
In other languages, one can make a FeaturePlot3D-esque graphics where the inset images look realistically three dimensional. Meaning that they are smaller when farther away (and also hazier).

So how can we exactly recreate this clustering of mnist:

enter image description here

Is there a way to recreate this effect in Graphics3D or FeaturePlot3D? Even trying the naive example above actually makes the front-end hang:

FeatureSpacePlot3D[ResourceData["MNIST"][[All, 1]], Method -> "TSNE"]
$\endgroup$
9
  • 3
    $\begingroup$ You can get a better sense of geometrical perspective by adjusting the effective viewing distance, e.g., between Viewpoint -> {1,1,1} and {10,10,10}. Mathematica does not render lighting and shadows, so you'll never get the kind of realism of software designed for true computer graphics. $\endgroup$ Commented Aug 16, 2018 at 18:31
  • 1
    $\begingroup$ So you've found time to set a bounty but not to respond to my comment. Which is confusing because that would clarify what is a valid answer here. $\endgroup$
    – Kuba
    Commented Aug 30, 2018 at 5:30
  • 1
    $\begingroup$ Is it about the performance? What is missing? $\endgroup$
    – Johu
    Commented Aug 30, 2018 at 10:22
  • 1
    $\begingroup$ It's about being able to recreate the exactly styling and look $\endgroup$
    – M.R.
    Commented Aug 30, 2018 at 14:42
  • 1
    $\begingroup$ If you stack a Image3D instance with Graphics3D, it will emulate fog effect. It was asked before, I but forgot where. $\endgroup$
    – kh40tika
    Commented Sep 2, 2018 at 11:35

2 Answers 2

3
$\begingroup$
data = RandomSample[ResourceData["MNIST", "TestData"], 1000];
pts = DimensionReduce[data[[All, 1]], 3, Method -> "TSNE"];
imgs = data[[All, 1]]; classes = data[[All, 2]]; pr = MinMax /@ Transpose[pts];
mm = MinMax[(1/EuclideanDistance[{pr[[1, 2]], pr[[2, 1]], pr[[3, 2]]}, #]) & /@ pts];
vp = {1.3`, -2.4`, 2.`}; vp = {0, -2, 2};
ir[pt : {x_, y_, z_}, img_, class_] := {Opacity[1], 
   Glow[ColorData["Rainbow"][(class + 1)/10.]], 
   Texture[ImageMultiply[img, ColorData["Rainbow"][(class + 1)/10.]]], EdgeForm[{Thin}], 
   Tooltip[GeometricTransformation[
     GeometricTransformation[GeometricTransformation[
       Polygon[{{-1, -1, 0}, {1, -1, 0}, {1, 1, 0}, {-1, 1, 0}}, 
        VertexTextureCoordinates -> {{0,
           0}, {1, 0}, {1, 1}, {0, 1}}], 
       TranslationTransform[{x, y, z}]], 
      RotationTransform[45 \[Degree], {1, 0, 1}]], 
     ScalingTransform[{1, 1, 1}]], pt]};
g = Graphics3D[MapThread[ir, {pts, imgs, classes}],
  ImageSize -> 400, Axes -> True, AxesLabel -> {"x", "y", "z"}]
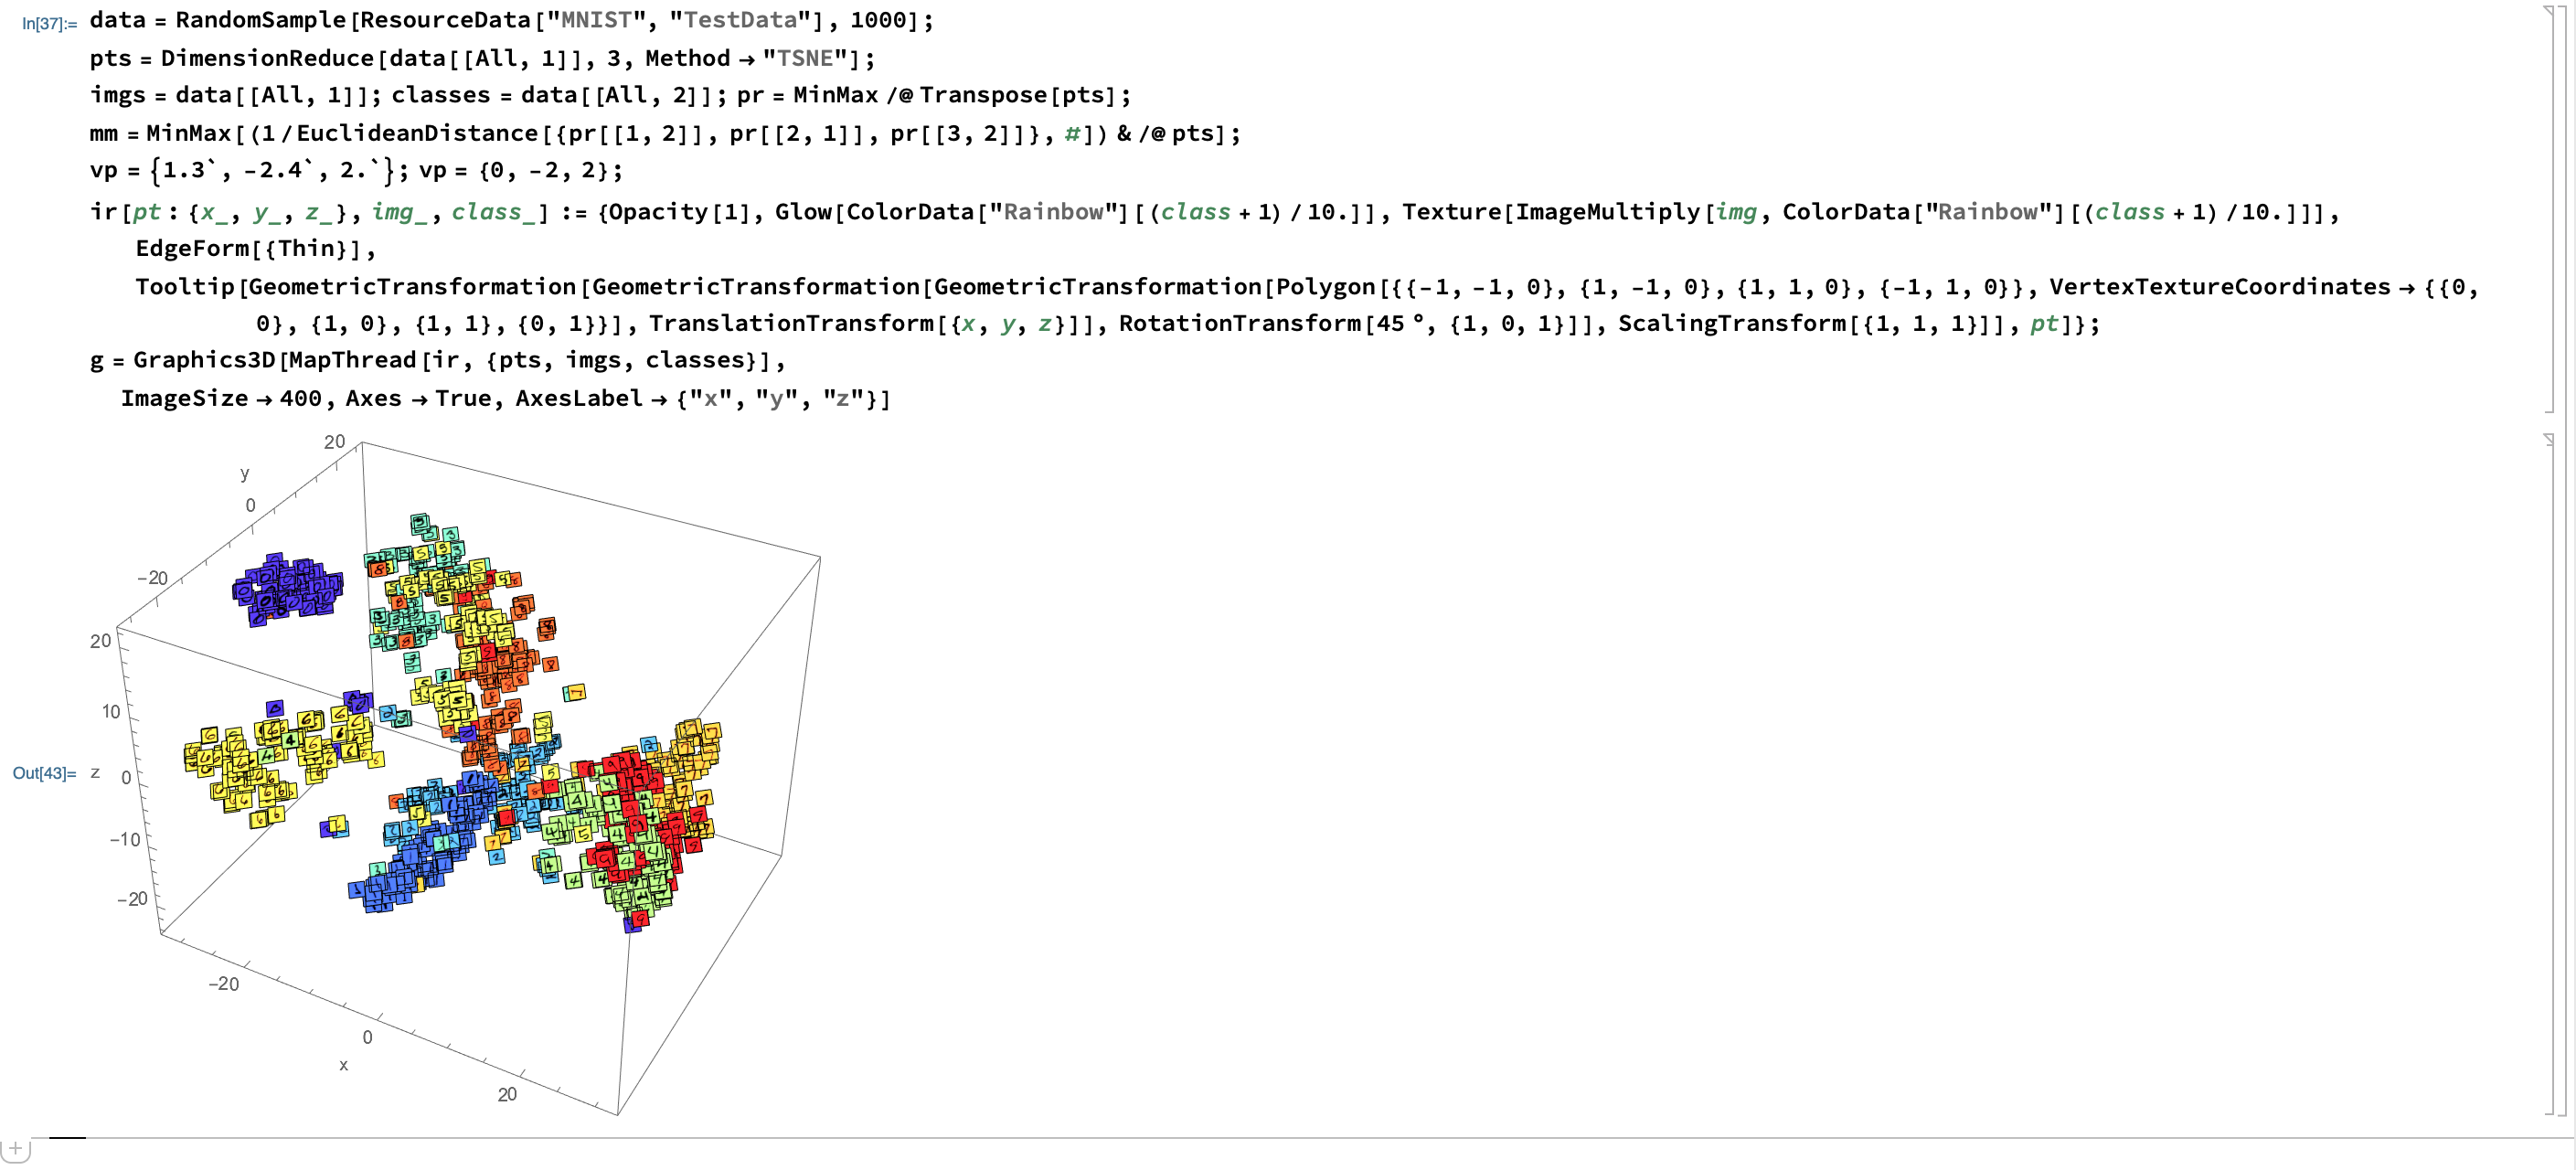
enter image description here

$\endgroup$
2
  • $\begingroup$ What about the cloudiness? And smooth framerates? $\endgroup$
    – user5601
    Commented Nov 5, 2019 at 3:59
  • $\begingroup$ That’s currently beyond Mathematica’s abilities, this is the best you’ll get $\endgroup$
    – M.R.
    Commented Nov 5, 2019 at 4:01
-3
$\begingroup$

The simple way is combination of some 3D objects by Show like following: 1. Lets make the 3D-shift functions defining the positions of objects in joint figure (+-0.25 in X-direction and 0.25 in Y-dir.):

shift = {#[[1]] + 0.25, #[[2]], #[[3]]} &;
shift2 = {#[[1]] - 0.25, #[[2]] + 0.25, #[[3]]} &;

Next, let's take the samples of 3D shapes from Wolfram:

sample1 = shift /@ ExampleData[{"Geometry3D", "StanfordBunny"},"VertexData"];
sample2 = shift2 /@ ExampleData[{"Geometry3D", "Cow"}, "VertexData"];

And draw them:

Show[
 ListSurfacePlot3D[sample1, MaxPlotPoints -> 50, PlotStyle -> Red],
 ListSurfacePlot3D[sample2, MaxPlotPoints -> 55]
 ]

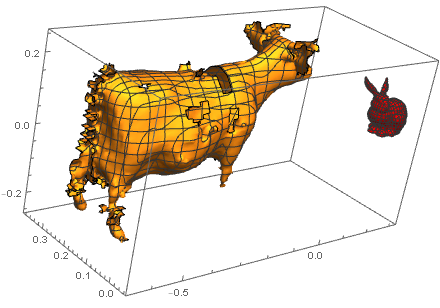
enter image description here

Sorry, but cow looks ill :)

$\endgroup$
4
  • $\begingroup$ The cow looks less ill when you use the respective MeshRegions: Show[ MeshRegion[ Translate[ ExampleData[{"Geometry3D", "StanfordBunny"}, "MeshRegion"], {0.25, 0., 0.} ], MeshCellStyle -> {{2, All} -> Directive[FaceForm[ColorData[97][4]]]} ], MeshRegion[ Translate[ ExampleData[{"Geometry3D", "Cow"}, "MeshRegion"], {-0.25, 0.25, 0.} ], MeshCellStyle -> {{2, All} -> Directive[FaceForm[ColorData[97][1]]]} ] ]. But I doubt that this will answer OP's question. $\endgroup$ Commented Aug 30, 2018 at 6:05
  • $\begingroup$ Mathematica also has built in commands for coordinate transformations, like Translate. $\endgroup$
    – Johu
    Commented Aug 30, 2018 at 10:23
  • $\begingroup$ @HenrikSchumacher, The perspective can be added directly clicking onto the plot. All rest looks like described in OP. $\endgroup$
    – Rom38
    Commented Aug 30, 2018 at 13:56
  • 2
    $\begingroup$ @Rom38 I guess, OP's question was more about the fog. That's funny because we all remember these 3D-games from the 90s where all this fog was necessary only because of poor hardware. ^^ $\endgroup$ Commented Aug 30, 2018 at 15:07

Your Answer

By clicking “Post Your Answer”, you agree to our terms of service and acknowledge you have read our privacy policy.

Not the answer you're looking for? Browse other questions tagged or ask your own question.