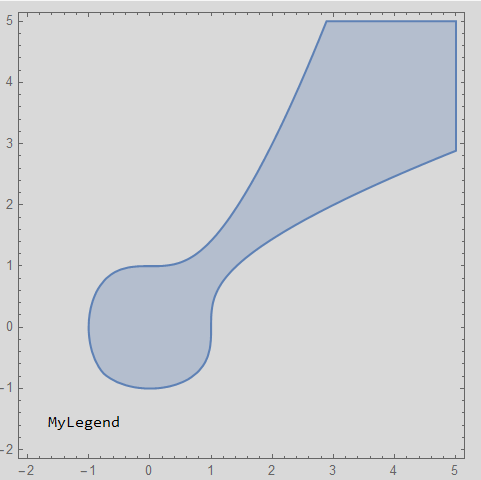
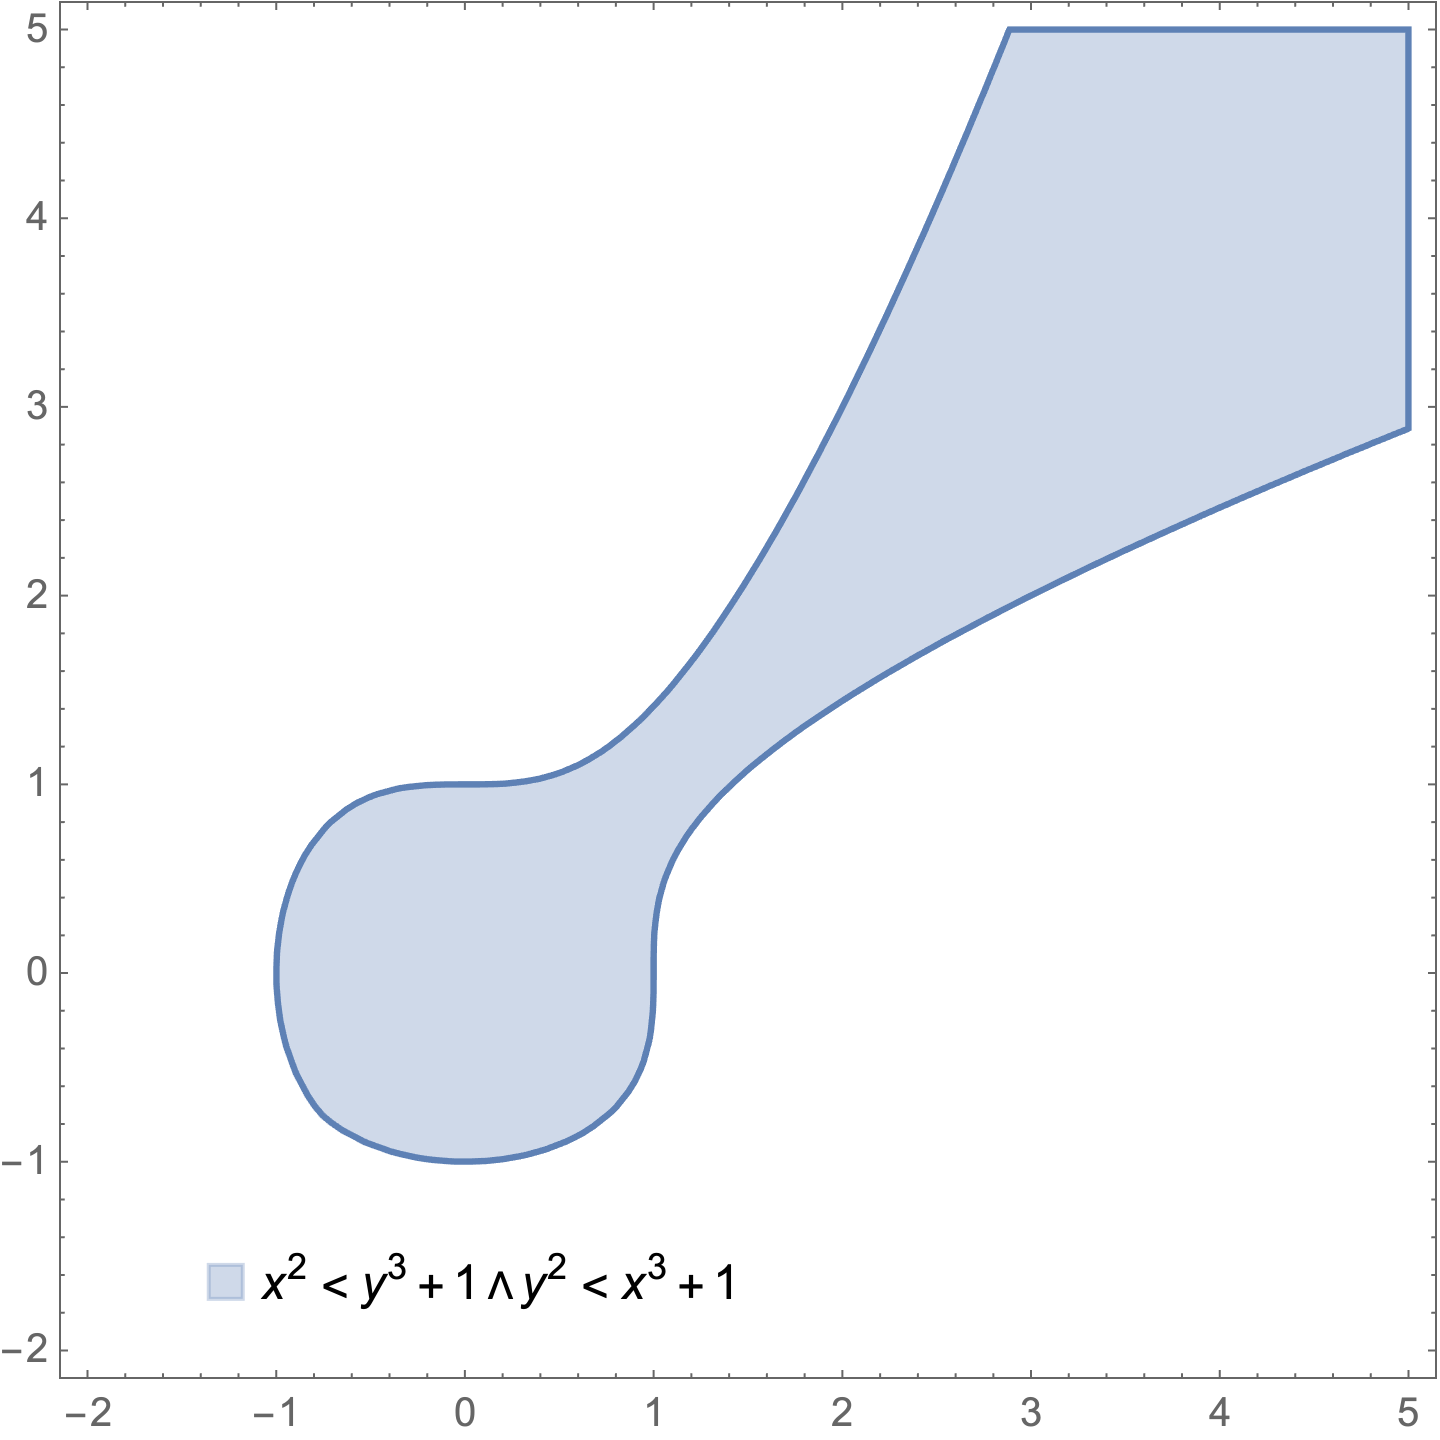
I only have one region plot and still want to get the legend (both marker and label). I tried the following, but why the legend market does not show up?
RegionPlot[x^2 < y^3 + 1 && y^2 < x^3 + 1, {x, -2, 5}, {y, -2, 5}, PlotLegends -> Placed["MyLegend", {0.15, 0.08}]]
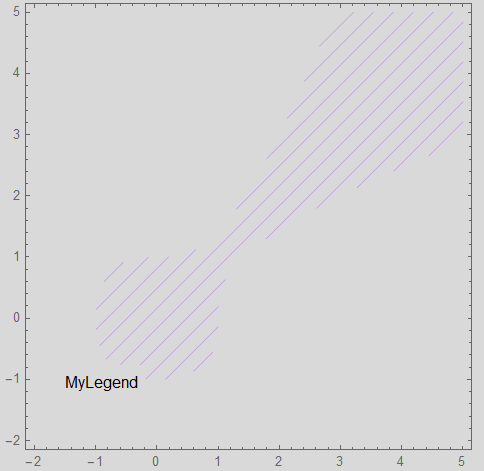
Edit: Thanks @kglr for pointing out that {"MyLegend"} works in the original simple example. This helped me realize that what I want to achieve is slightly different. Since I use mesh to highlight the region, I was trying to get the legend for the mesh. Please see the code below:
RegionPlot[x^2 < y^3 + 1 && y^2 < x^3 + 1, {x, -2, 5}, {y, -2, 5}, MeshFunctions -> {#1 - #2 &}, Mesh -> 12, MeshStyle -> {Hue[0.75], Opacity[0.3]}, PlotStyle -> None, BoundaryStyle -> None, PlotLegends -> Placed[{"MyLegend"}, {0.15, 0.15}]]

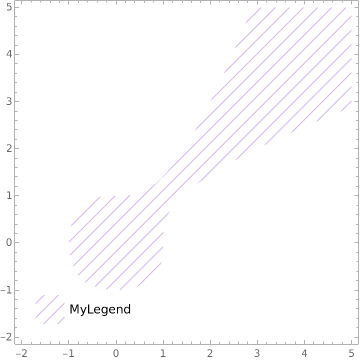
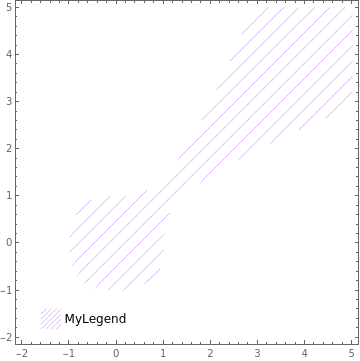
PlotLegends -> Placed[{"MyLegend"}, {0.15, 0.08}]? $\endgroup$RegionPlot[x^2 < y^3 + 1 && y^2 < x^3 + 1, {x, -2, 5}, {y, -2, 5}, BoundaryStyle -> None, PlotStyle -> HatchFilling[45, 1, 3], PlotLegends -> Placed["AllExpressions", {0.25, 0.8}]]$\endgroup$