3
$\begingroup$

I am wondering if there is a way to force the plot legend symbol for each respective plot. I am currently using a package created by AlexeyPopkov, which corrects the off-centre plot marker issue very nicely. For reference the link to the package is: How can we make publication-quality PlotMarkers without version 10?

Needs["PolygonPlotMarkers`"]
PLOT = ListLinePlot[DATA, Frame -> True, FrameStyle -> Directive[Black, Thin], Axes -> False, BaseStyle -> Opacity[0.999], ImageSize -> 400, PlotStyle -> Directive[Blue, Thin], PlotMarkers -> {Graphics[{FaceForm[Black], EdgeForm[Black], PolygonMarker["Circle", Scaled[0.03]]}]}, PlotLegends -> Placed[{Style["Plot Legend Label", Black,10]}, {Left, Top}, Pane[#, 450, Alignment -> Left] &]];

However the new plot markers do not appear in the plot legend, only the plot lines. Is there a way to force a plot marker onto a plot legend specifically using Graphics? I tried using PlotLegends->Automatic but nothing renders at all in this case.

Needs["PolygonPlotMarkers`"]
PLOT = ListLinePlot[DATA, Frame -> True, FrameStyle -> Directive[Black, Thin], Axes -> False, BaseStyle -> Opacity[0.999], ImageSize -> 400, PlotStyle -> Directive[Black, Thin], PlotMarkers -> {Graphics[{FaceForm[Black], EdgeForm[Black], PolygonMarker["Circle", Scaled[0.03]]}]}, PlotLegends -> Automatic]

Cheers all!

$\endgroup$
0

2 Answers 2

4
$\begingroup$

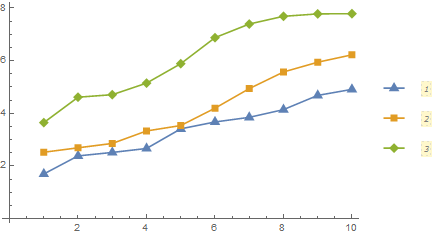
It is as simple as follows using Mathematica 10 or higher:

Needs["PolygonPlotMarkers`"]

fm[name_, size_: 7] := 
 Graphics[{EdgeForm[], PolygonMarker[name, Offset[size]]}, AlignmentPoint -> {0, 0}]

ListPlot[Table[Accumulate@RandomReal[1, 10] + i, {i, 3}], 
 PlotMarkers -> fm /@ {"Triangle", "Square", "Diamond"}, Joined -> True, 
 PlotLegends -> PointLegend[Automatic, LegendMarkerSize -> {40, 20}]]

plot

Note that the sizes of the plot markers in the plot and in the legend are identical because the Offset size specification is used (possible size specifications are documented in the "Description of the package" section of the original answer).

$\endgroup$
1
  • $\begingroup$ Managed to finally get this working! Thanks for all the help nice work with the PolygonPlotMarkers Package - it's great! $\endgroup$
    – user27119
    Commented Jun 9, 2016 at 17:01
6
$\begingroup$

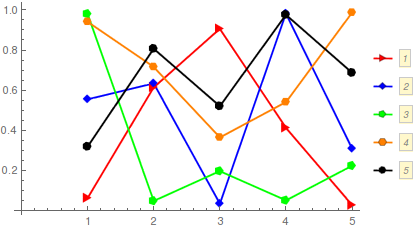
I don't know about PolygonPlotMarkers` package, so I am presenting a general solution. You can always define your own Graphics as markers. For example, I use here regular polygons

col = {Red, Blue, Green, Orange, Black};
marker[col_, n_] := Graphics[{col, 
                 Polygon[{Cos[2 Pi #/n], Sin[2 Pi #/n]} & /@ Range[n]]}
                 ,ImageSize -> 10]

ListLinePlot[RandomReal[1, {5, 5}], PlotStyle -> col,
  PlotMarkers -> Table[marker[col[[n]], n + 2], {n, 5}], 
  PlotLegends -> True]

enter image description here

You can use any figure or text or symbol for the markers.

$\endgroup$
1
  • $\begingroup$ Thanks for the answer, it's a nice alternative solution! $\endgroup$
    – user27119
    Commented Jun 9, 2016 at 17:01

Your Answer

By clicking “Post Your Answer”, you agree to our terms of service and acknowledge you have read our privacy policy.

Not the answer you're looking for? Browse other questions tagged or ask your own question.