2
$\begingroup$

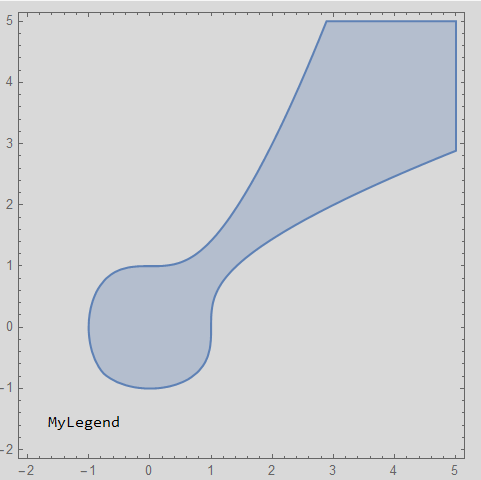
I only have one region plot and still want to get the legend (both marker and label). I tried the following, but why the legend market does not show up?

RegionPlot[x^2 < y^3 + 1 && y^2 < x^3 + 1, {x, -2, 5}, {y, -2, 5}, PlotLegends -> Placed["MyLegend", {0.15, 0.08}]]

enter image description here


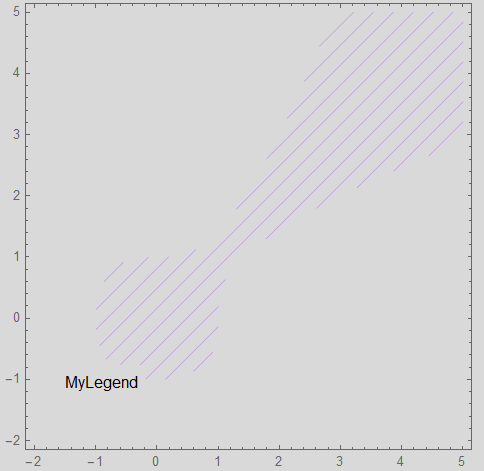
Edit: Thanks @kglr for pointing out that {"MyLegend"} works in the original simple example. This helped me realize that what I want to achieve is slightly different. Since I use mesh to highlight the region, I was trying to get the legend for the mesh. Please see the code below:

RegionPlot[x^2 < y^3 + 1 && y^2 < x^3 + 1, {x, -2, 5}, {y, -2, 5}, MeshFunctions -> {#1 - #2 &}, Mesh -> 12, MeshStyle -> {Hue[0.75], Opacity[0.3]}, PlotStyle -> None, BoundaryStyle -> None, PlotLegends -> Placed[{"MyLegend"}, {0.15, 0.15}]]

enter image description here

$\endgroup$
2
  • 2
    $\begingroup$ try PlotLegends -> Placed[{"MyLegend"}, {0.15, 0.08}]? $\endgroup$
    – kglr
    Commented May 3, 2021 at 3:36
  • $\begingroup$ RegionPlot[x^2 < y^3 + 1 && y^2 < x^3 + 1, {x, -2, 5}, {y, -2, 5}, BoundaryStyle -> None, PlotStyle -> HatchFilling[45, 1, 3], PlotLegends -> Placed["AllExpressions", {0.25, 0.8}]] $\endgroup$
    – cvgmt
    Commented May 3, 2021 at 5:23

2 Answers 2

3
$\begingroup$

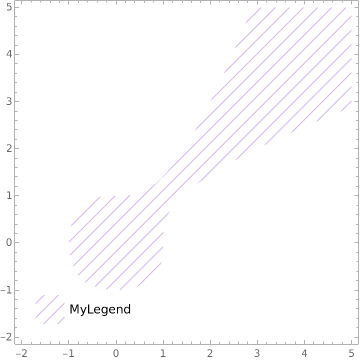
If the only reason for using Mesh is to get a hatch filling for the region, you can use HatchFilling:

RegionPlot[x^2 < y^3 + 1 && y^2 < x^3 + 1, {x, -2, 5}, {y, -2, 5}, 
 PlotStyle -> Directive[Hue @ .75, Opacity @ .3, HatchFilling[Pi/4, 0, 10]], 
 BoundaryStyle -> None, 
 PlotLegends -> Placed[SwatchLegend[{"MyLegend"}, LegendMarkerSize -> 30], {0.2, 0.1}]]

enter image description here

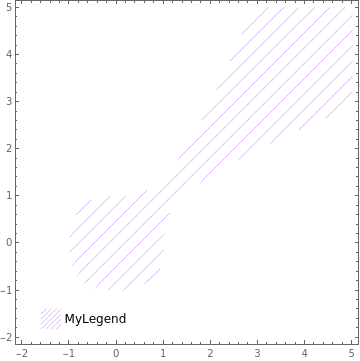
If you have to use Mesh + MeshStyle you can do

legendmarker = RegionPlot[True, {x, 0, 1}, {y, 0, 1}, 
  Frame -> False, 
  MeshFunctions -> {#1 - #2 &}, Mesh -> 7, 
  MeshStyle -> Directive[Hue[0.75], Opacity[0.3]], 
  PlotStyle -> None, BoundaryStyle -> None];

RegionPlot[x^2 < y^3 + 1 && y^2 < x^3 + 1, {x, -2, 5}, {y, -2, 5}, 
 MeshFunctions -> {#1 - #2 &}, Mesh -> 12, 
 MeshStyle -> {Hue[0.75], Opacity[0.3]}, PlotStyle -> None, 
 BoundaryStyle -> None, 
 PlotLegends -> Placed[SwatchLegend[ {"MyLegend"}, LegendMarkerSize -> {20, 20}, 
    LegendMarkers -> {legendmarker}], {0.2, 0.075}]] 

enter image description here

$\endgroup$
2
  • $\begingroup$ The use of HatchFilling looks good. However, this command seems not recognized by my Mathematica 11.0. The color of this command is blue when I typed it, and the graph does not have parallel lines. So I guess this a version issue $\endgroup$
    – RandomBear
    Commented May 3, 2021 at 18:09
  • 1
    $\begingroup$ I upgraded my software to 12.2 - now it works. Thanks! $\endgroup$
    – RandomBear
    Commented May 3, 2021 at 19:01
2
$\begingroup$
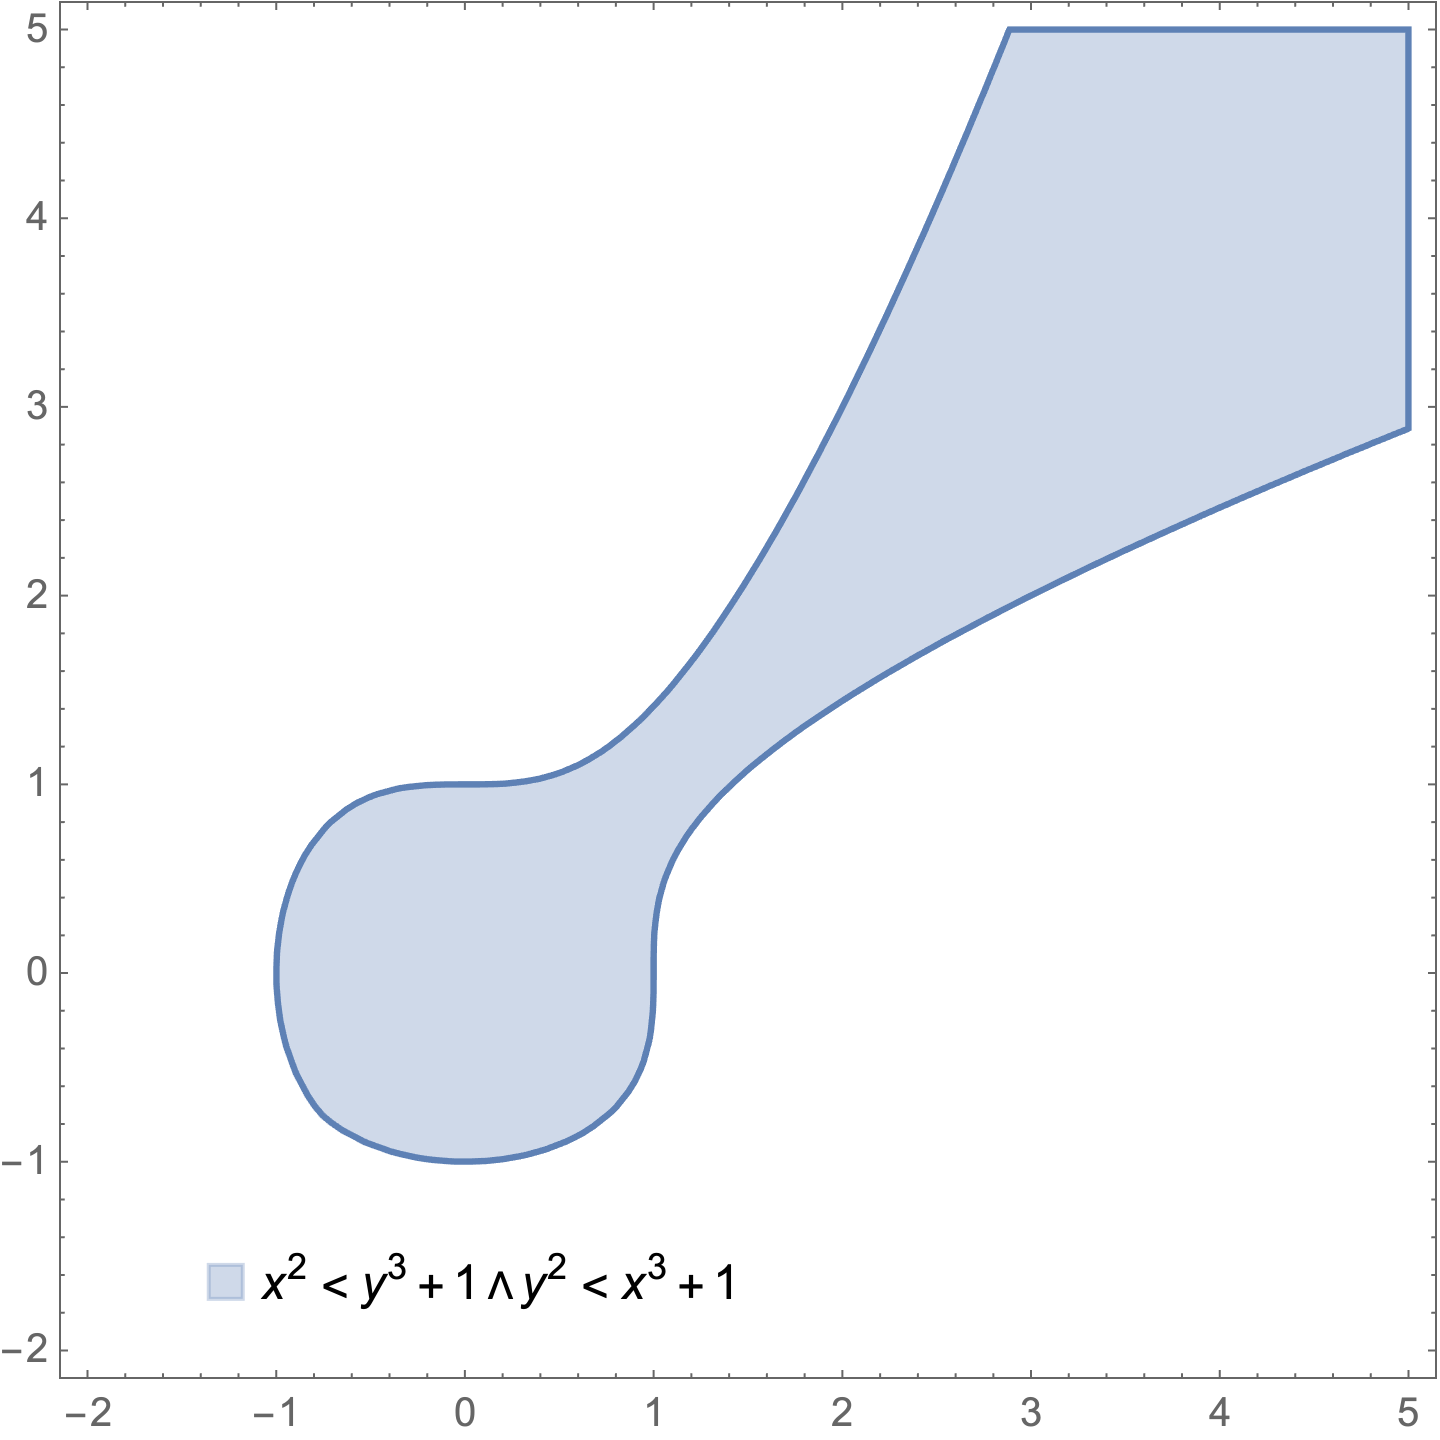
RegionPlot[x^2 < y^3 + 1 && y^2 < x^3 + 1,
 {x, -2, 5}, {y, -2, 5},
 PlotLegends -> 
  Placed[SwatchLegend[{x^2 < y^3 + 1 && y^2 < x^3 + 1}], {0.3, .07}]]

enter image description here

$\endgroup$

Your Answer

By clicking “Post Your Answer”, you agree to our terms of service and acknowledge you have read our privacy policy.

Not the answer you're looking for? Browse other questions tagged or ask your own question.