2
$\begingroup$

I am trying to evaluate the properties of a multivariate function $f(a,b,x,y)$ with respect to $x$ and $y$ given assumptions for $a$ and $b$.

An example without $a$ and $b$.

RegionPlot[{x*y > 0, x*y < 0}, {x, -2, 2}, {y, -2, 2}]

How can I include that for example $a > 0$ and $b < 0$ for $a\,b\,x\,y$? The ultimate goal is to evaluate the sign for $f(a,b,x,y)$ given a set of parameters $a$ and $b$.

I have tried Plot, RegionPlot, Plot[Sign[...]], etc., without success.

$\endgroup$
7
  • 1
    $\begingroup$ I don't understand what you want to plot for the condition $a>0$. Do you want $f(.1, b, x, y)$, $f(.2, b, x, y)$, and so on for an infinite number of graphs? Also, please eliminate extraneous code that is irrelevant to your question (viz. PlotLegends). $\endgroup$ Commented Sep 18, 2015 at 18:19
  • $\begingroup$ I want a two-dimensional graph for (x,y) whose effects are most important but (a,b) are parameters with any positive or negative values that can be kept constant for evaluation. I could set specific values for (a,b) as examples but I would prefer a general discussion of (x,y)-effects. $\endgroup$
    – Tom
    Commented Sep 18, 2015 at 18:23
  • $\begingroup$ What can you possibly mean--rigorously, mathematically--by "most important"? How can you possibly get a "general discussion..."? Show us one concrete example (done by hand, if necessary). Also, please edit your question to eliminate irrelevant code, as I suggested before. $\endgroup$ Commented Sep 18, 2015 at 18:30
  • $\begingroup$ A simple example would be an output function with multiple inputs. All inputs have an effect on output but I am mostly interested in the effects of, say, capital or labor. However, whether the effects are positive or negative may depend on the specific values of other inputs - why I want to keep their exact values unspecified. $\endgroup$
    – Tom
    Commented Sep 18, 2015 at 18:41
  • $\begingroup$ Your "example" is far too vague. Please write an equation involving $a,b,x,f$ and what you seek. I've given a possible answer using Manipulate but you are too vague about what you're seeking. Don't talk about capital or labor. Give equations! $\endgroup$ Commented Sep 18, 2015 at 18:44

2 Answers 2

5
$\begingroup$

This is what you asked for:

Manipulate[
  RegionPlot[a x y - b > 0, {x, 0, 1}, {y, 0, 1}],
  {{a, .5}, 0, 1}, {{b, .25}, 0, .5}]
$\endgroup$
4
  • $\begingroup$ Thank you. Is there a possibility to specify that 0<b<a -- e.g., a>0, b>0 and b<a? $\endgroup$
    – Tom
    Commented Sep 22, 2015 at 21:21
  • $\begingroup$ Certainly: Manipulate[RegionPlot[a x y - b > 0, {x, 0, 1}, {y, 0, 1}], {{a, .5}, 0, 1}, {{b, .25}, 0, a}]. I urge you to read the documentation on Manipulate, which describes all these concepts clearly. $\endgroup$ Commented Sep 22, 2015 at 21:24
  • $\begingroup$ My apologies for the misunderstanding. The question was regarding RegionPlot without using Manipulate and allowing a, b to be greater than 1. $\endgroup$
    – Tom
    Commented Sep 22, 2015 at 21:34
  • $\begingroup$ Now I have no idea what you want, as I stated in my first comment (above). $\endgroup$ Commented Sep 22, 2015 at 22:00
5
$\begingroup$

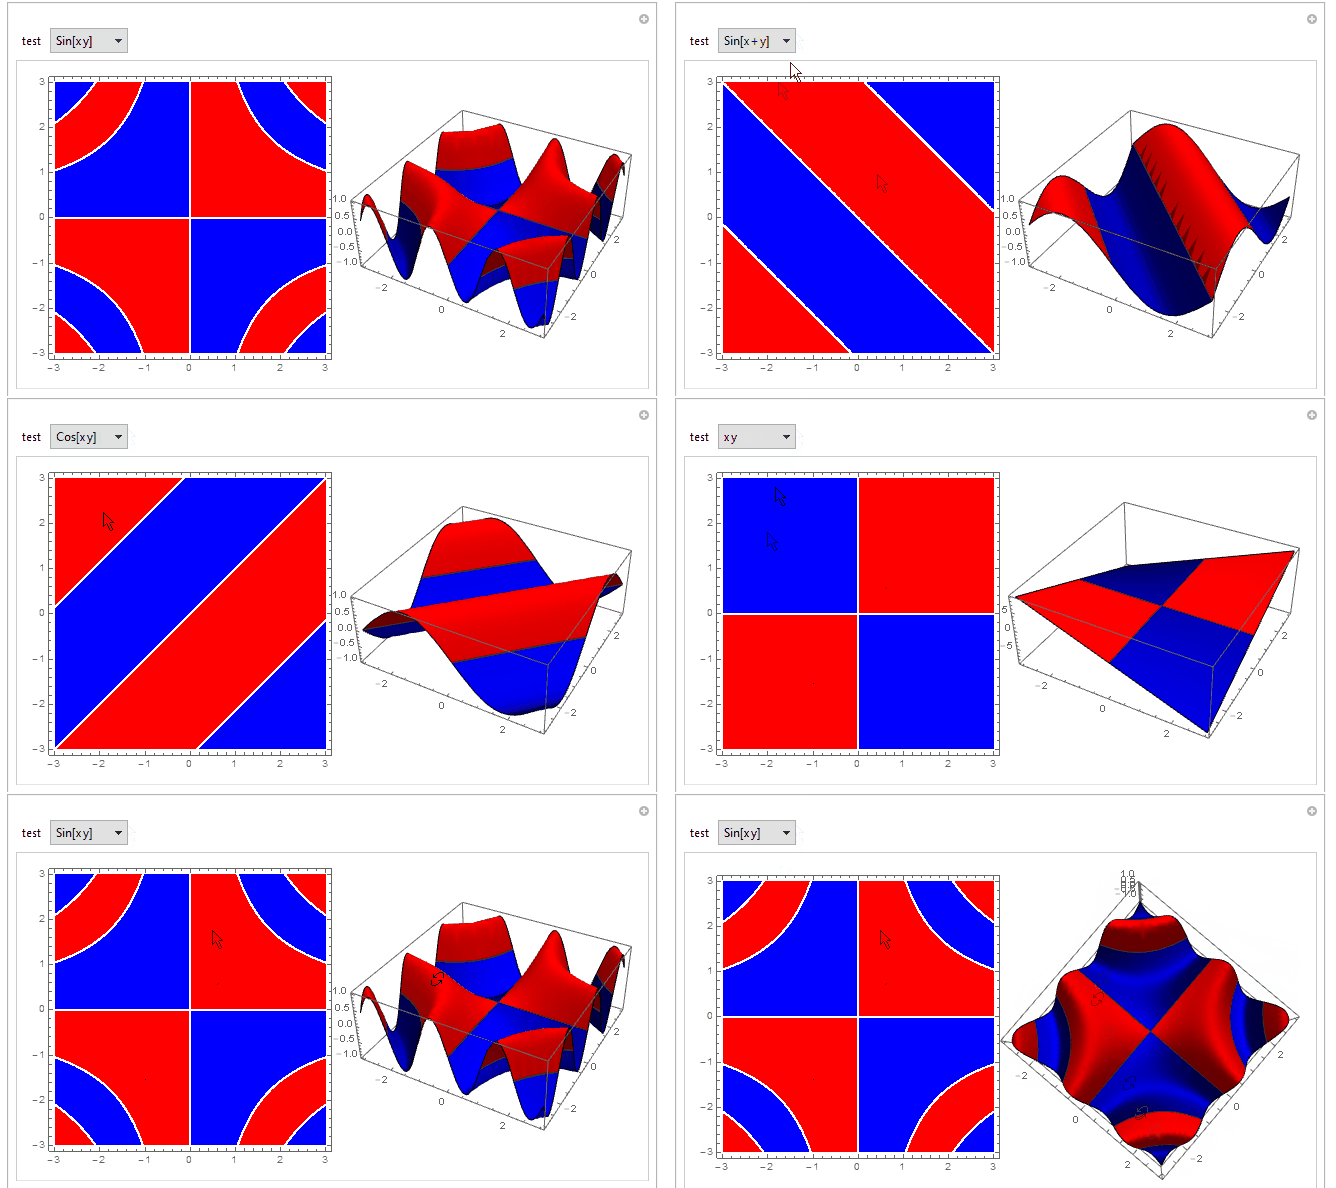
I am not sure what the aim is here. I post this to illustrate shading approaches in case it may be helpful. Shading by sign of function:

fun[f_] := 
 Row[{ContourPlot[ Sign[f], {x, -3, 3}, {y, -3, 3}, 
    Contours -> {-1, 1}, ContourShading -> {Red, Blue}, 
    ImageSize -> 300],
   Plot3D[f, {x, -3, 3}, {y, -3, 3}, MeshFunctions -> (Sign@#3 &), 
    MeshShading -> {Blue, Red}, ImageSize -> 300]}]

Examples:

Manipulate[
 fun[test], {test, {Sin[x y], Sin[x + y], Sin[x - y], Cos[x y], x y, 
   x + y, x - y}}]

enter image description here

Obviously, you can use manipulate for parameter tuning a and b.

$\endgroup$

Your Answer

By clicking “Post Your Answer”, you agree to our terms of service and acknowledge you have read our privacy policy.

Not the answer you're looking for? Browse other questions tagged or ask your own question.