1
$\begingroup$

I will try to illustrate my question with an example:

Let us define the RegionPlot for b and y as

ybregion=RegionPlot[Sin[b]^2 + Sinh [y] <= 1, {y, 0, 1}, {b, 0, 1}, FrameLabel -> Automatic]

for 0 <= b <= 1 and 0 <= y <= 1. Moreover, we have 0 <= a <= 1 and 0 <= x <= by^2. Notice that the interval for x depends on b and y satisfying e.g. Sin[b]^2 + Sinh [y] <= 1. Let us define, for example, the function

f = a + (b x)/y

I would like to make a plot such that we can see the cases f=0,1,2, for example, in terms of a and b as an (a,b,f) plot. My problem is to handle with the condition Sin[b]^2 + Sinh [y] <= 1 and with the four variables of f. In my original problem a, b, f are physical parameters so a useful plot should be one without x, y.

$\endgroup$

1 Answer 1

2
$\begingroup$

Let me offer some possible plots.

First regard, that the x-y area is very limited.

RegionPlot3D[
   0 <= x <= b y^2 && Sin[b]^2 + Sinh[y] <= 1 && 0 <= y <= 1 && 
   0 <= b <= 1 && 0 <= x <= 1, {x, 0, 1}, {y, 0, 1}, {b, 0, 1}, 
   PlotPoints -> 100]

{xmax, parxmax} = 
  NMaximize[{x, 
  0 <= x <= b y^2 && Sin[b]^2 + Sinh[y] <= 1 && 0 <= y <= 1 && 
0 <= b <= 1 && 0 <= x <= 1}, {x, {y, 0, 1/2}, b}]

{ymax, parymax} = 
  NMaximize[{y, 
     0 <= x <= b y^2 && Sin[b]^2 + Sinh[y] <= 1 && 0 <= y <= 1 && 
  0 <= b <= 1 && 0 <= x <= 1}, {x, {y, 0, 1/2}, b}]

Edit Corrected typos, got changed pictures.

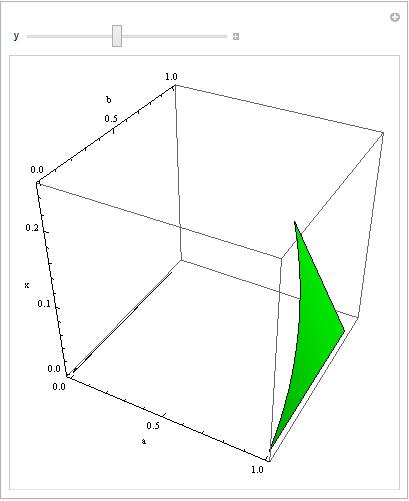
See f = 1 depending an a,b,x,y

Manipulate[
 ContourPlot3D[a + (b x)/y, {a, 0, 1}, {b, 0, 1}, {x, 0, xmax}, 
 RegionFunction -> 
 Function[{a, b, x}, 0 <= x <= b y^2 && Sin[b]^2 + Sinh[y] <= 1], 
 Contours -> {0, 1, 2, 3}, ContourStyle -> {Red, Green, Blue, Cyan}, 
 PlotPoints -> 30, Mesh -> False, 
 AxesLabel -> {"a", "b", "x"}], {{y, .4}, 0, ymax}]

enter image description here

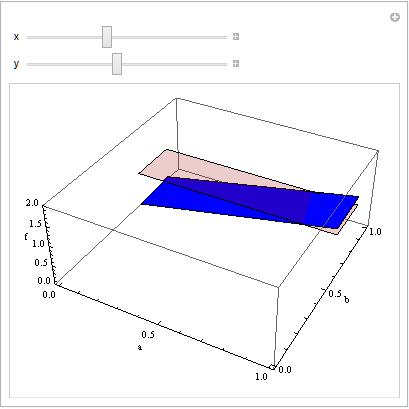
Or a plot of f[a,b] and x,y as parameters.

Manipulate[
  Plot3D[{1, a + (b x)/y}, {a, 0, 1}, {b, 0, 1}, 
 RegionFunction -> 
 Function[{a, b, f}, 0 <= x <= b y^2 && Sin[b]^2 + Sinh[y] <= 1], 
 AxesLabel -> {"a", "b", "f"}, PlotRange -> {0, 2}, 
 ClippingStyle -> Opacity[0.2], 
 PlotStyle -> {{Red, Opacity[.2]}, Blue}, Mesh -> False], {{x, .1}, 
 0, xmax}, {{y, .4}, 0, ymax}]

enter image description here

$\endgroup$

Your Answer

By clicking “Post Your Answer”, you agree to our terms of service and acknowledge you have read our privacy policy.

Not the answer you're looking for? Browse other questions tagged or ask your own question.