1
$\begingroup$

How can I plot the function

F[x_,a_]:=Integrate[Abs[x - z]^(-1-2a), {z, -Infinity, -1}] + Integrate[Abs[x - z]^(-1-2a), {z, 1, Infinity}]

for x in (-1,1) and a in (0,1)? I have been using Wolfram Cloud to do Plot[F[x,1], {x,-1,1}], but I get that the computational time is exceeded So my questions are:

  • What does the plot look like? Is this an error or just a long computation?
  • If I wrote Plot[F[x,a], {x,-1,1}, {a,0,1}] would it work to plot in the same picture the function F[x] for the various values of a? What if I just want to plot some values of a, for example a = 1/4, 1/3, 1/2, 2/3, 3/4, 1?
$\endgroup$

2 Answers 2

3
$\begingroup$

Using some assumptions and an immediate assignment gives an analytic integral, which is easy to plot:

F[x_, a_] = Assuming[-1 <= x <= 1 && a > 0,
  Integrate[Abs[x - z]^(-1 - 2 a), {z, -Infinity, -1}] + 
  Integrate[Abs[x - z]^(-1 - 2 a), {z, 1, Infinity}]]

(*    (1 - x)^(-2 a)/(2 a) + (1 + x)^(-2 a)/(2 a)    *)

The plot looks exactly like the one of @Andreas' answer.

$\endgroup$
2
  • $\begingroup$ Thanks! Can i ask you too if it's possible to plot it in 1-d, with lines of different colors to represent the various values of a? $\endgroup$
    – Jun
    Commented Apr 16, 2021 at 20:21
  • $\begingroup$ Plot[Evaluate@Table[F[x, a], {a, {1/4, 1/3, 1/2, 2/3, 3/4, 1}}], {x, -1, 1}] $\endgroup$
    – Roman
    Commented Apr 16, 2021 at 20:22
1
$\begingroup$

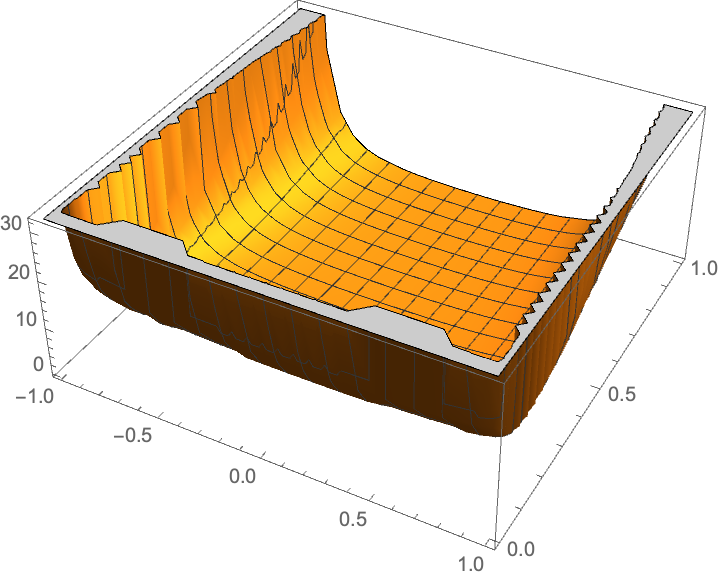
You can do numerical integration and a 3D plot like:

Plot3D[NIntegrate[Abs[x - z]^(-1 - 2 a), {z, -Infinity, -1}] + 
NIntegrate[Abs[x - z]^(-1 - 2 a), {z, 1, Infinity}], {x, -1, 1},    {a,0,1}]

enter image description here

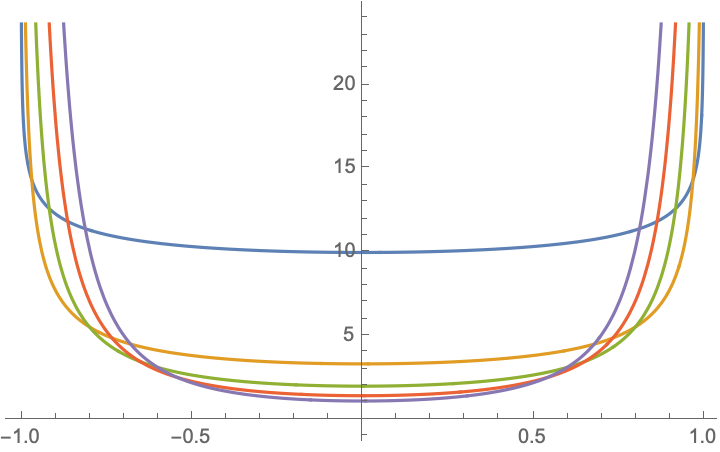
a 1-d plot could look like

Plot[Evaluate[
 Table[((1 - x)^(-2*a) + (1 + x)^(-2*a))/(2*a), {a, 0.1, 1, 0.2}]], 
{x, -1, 1}]

enter image description here

$\endgroup$
6
  • $\begingroup$ Thank you. I still get the output on the computational time exceeded though. Could you please add a plot to your answer? $\endgroup$
    – Jun
    Commented Apr 16, 2021 at 20:03
  • $\begingroup$ Thank you. Is it also possible to plot it in 1-d, with lines of different colors to represent the various values of a? $\endgroup$
    – Jun
    Commented Apr 16, 2021 at 20:12
  • $\begingroup$ with @Roman s result Plot[Evaluate[ Table[((1 - x)^(-2*a) + (1 + x)^(-2*a))/(2*a), {a, 0.1, 1, 0.2}]], {x, -1, 1}] $\endgroup$
    – Andreas
    Commented Apr 16, 2021 at 20:27
  • $\begingroup$ Thanks. Could you add a picture of this too? $\endgroup$
    – Jun
    Commented Apr 16, 2021 at 20:33
  • $\begingroup$ Thank you so much! This is a big help. Is it possible to also have a legend of which colors correspond to which values of a? $\endgroup$
    – Jun
    Commented Apr 16, 2021 at 21:03

Your Answer

By clicking “Post Your Answer”, you agree to our terms of service and acknowledge you have read our privacy policy.

Not the answer you're looking for? Browse other questions tagged or ask your own question.