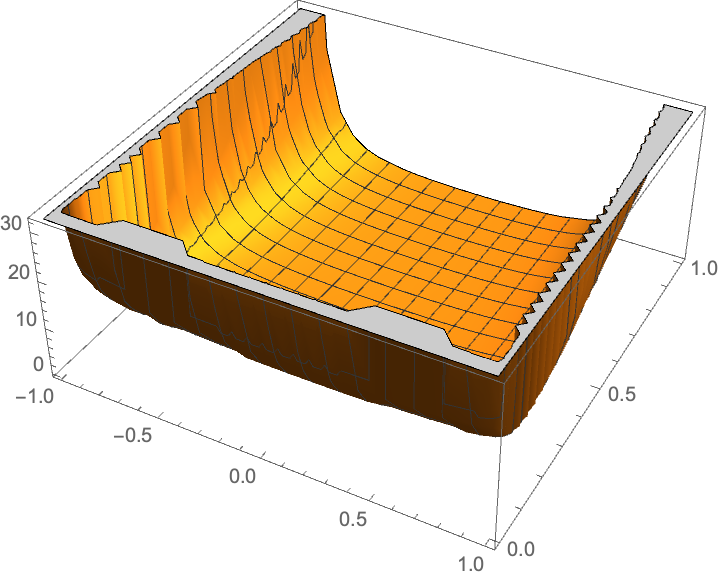
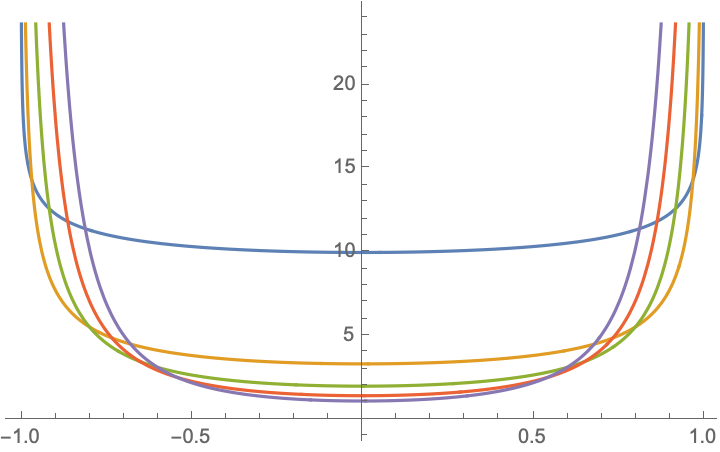
How can I plot the function
F[x_,a_]:=Integrate[Abs[x - z]^(-1-2a), {z, -Infinity, -1}] + Integrate[Abs[x - z]^(-1-2a), {z, 1, Infinity}]
for x in (-1,1) and a in (0,1)?
I have been using Wolfram Cloud to do
Plot[F[x,1], {x,-1,1}],
but I get that the computational time is exceeded
So my questions are:
- What does the plot look like? Is this an error or just a long computation?
- If I wrote
Plot[F[x,a], {x,-1,1}, {a,0,1}]would it work to plot in the same picture the function F[x] for the various values of a? What if I just want to plot some values of a, for example a = 1/4, 1/3, 1/2, 2/3, 3/4, 1?


