3
$\begingroup$

I want to fit a given data using the approach developed by @Bob Hanlon here: Fit and find fitting parameters of data given an equation

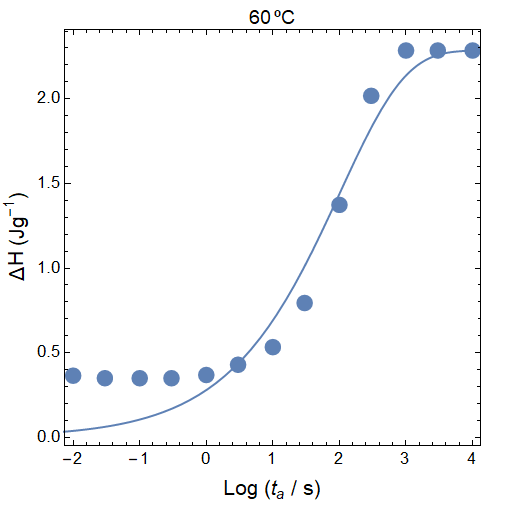
I have tried this approach for several different data sets but I have one in particular where the equation does not seem to fit the data very well but it is not very clear to me why or if I can "tweak the equation" or the parameters to make it fit well.

Here's the my data and the code I am using:

hey = {{-2.`, 0.3650687761296365`}, {-1.5228787452803376`, 
   0.35024185145494713`}, {-1.`, 
   0.35008362652827657`}, {-0.5228787452803376`, 
   0.35002569469868255`}, {-4.821637332766436`*^-17, 
   0.3690654823479624`}, {0.4771212547196624`, 
   0.4295109082336017`}, {1.`, 
   0.5336781026939912`}, {1.4771212547196624`, 
   0.7942359842488445`}, {2.`, 
   1.3736241822734323`}, {2.4771212547196626`, 
   2.0178692522958217`}, {3.`, 
   2.2855926539783797`}, {3.477121254719662`, 
   2.2855974030998034`}, {4.`, 2.2855975424841546`}}

(nlmp = NonlinearModelFit[
    hey, {2.2856 (1 - Exp[-(10^logt/tauc)^bc]), bc <= 1}, {tauc, bc}, 
    logt]) // Normal

nlmp["BestFitParameters"]

Show[
 
 ListPlot[hey, PlotMarkers -> {Automatic, 13}, AspectRatio -> 1 , 
  Frame -> True, PlotRange -> All, Axes -> False, ImageSize -> Medium,
   AspectRatio -> 1, FrameStyle -> Directive[Black, 13], 
  FrameLabel -> {Style["Log (\!\(\*SubscriptBox[\(t\), \(a\)]\) / s)",
      16], 
    Style["\[CapitalDelta]H (\!\(\*SuperscriptBox[\(Jg\), \(-1\)]\))",
      16]}, PlotLabel -> Style[Ta[[8 + 1]] "ºC", Black, 14]],
 
 Plot[nlmp[logt], {logt, -2.2, 4.2}, PlotRange -> All, 
  AspectRatio -> 1, Frame -> True, Axes -> False, AspectRatio -> 1, 
  FrameStyle -> Directive[Black, 13], 
  FrameLabel -> {Style["Log (\!\(\*SubscriptBox[\(t\), \(a\)]\) / s)",
      16], Style[
     "\!\(\*SubscriptBox[\(\[CapitalDelta]H\), \(a\)]\) (J/g)", 16]}, 
  Epilog -> {Red, AbsolutePointSize[4], Point[datac]}]
 
 ]

Which gives the following fit:

enter image description here

I have also tried simply using

(nlmp = NonlinearModelFit[hey, {2.2856 (1 - Exp[-(10^logt/tauc)^bc])**+ 0.35**, bc <= 1}, {tauc, bc},logt]) // Normal

and it of course fixes the fit in the bottom part but now the problem is in the upper part.

Question:

What is wrong with this particular data set and How could I modified the equation to make a correct fit (the lower part of the data is not correctly fitted)?

For reference, the fitting equation that I am using in nlmp is:

enter image description here

$\endgroup$
4
  • 4
    $\begingroup$ Frankly, I don't see how that formula can possibly fit that data. The asymptotic behaviour simply doesn't match. You could just throw in a fudge y-axis offset parameter, but there needs to be a clear physical or experimental motivation for that. $\endgroup$ Commented Dec 22, 2020 at 20:32
  • $\begingroup$ @SjoerdSmit thanks for your comment. One of my problems is that I do not know how to modify it "slightly" to make the data fit. For example, I used (nlmp = NonlinearModelFit[hey, {2.2856 (1 - Exp[-(10^logt/tauc)^bc])**+ 0.35**, bc <= 1}, {tauc, bc},logt]) // Normal and it fixes the bottom part but now the upper part is wrong. There must be a very simple combination where it can fit it completely, no?. I guess in my case, there is no need for that to have a physical meaning $\endgroup$
    – John
    Commented Dec 22, 2020 at 20:39
  • 3
    $\begingroup$ To keep the original definition for delHinf the asymptotic behavior would be Ha == offset + (delHinf - offset) (1 - Exp[-(10^logt/tauc)^bc]) $\endgroup$
    – Bob Hanlon
    Commented Dec 22, 2020 at 20:52
  • $\begingroup$ @BobHanlon again so helpful! Thank you very much for this suggestion!. That's the best combination to not modified the original definition of delHinf. Thanks again for your help ! $\endgroup$
    – John
    Commented Dec 22, 2020 at 21:04

1 Answer 1

8
$\begingroup$

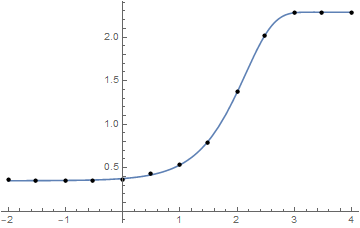
The equation you show will never fit your data because it cannot reproduce the asymptotic behavior at negative logt. You need to add a constant vertical offset for it do so:

nlm = NonlinearModelFit[
   hey, {deltaHinf (1 - E^-(10^logt/tau0)^beta) + const, beta <= 1},
   {{deltaHinf, 2.2}, {beta, 0.6}, {tau0, 200}, {const, 0.2}},
   logt
   ];

Show[
 Plot[nlm[logt], Evaluate@Flatten@{logt, MinMax[hey[[All, 1]]]}],
 ListPlot[hey, PlotStyle -> Black]
]

nlm["BestFitParameters"]

(* Out: {deltaHinf -> 1.9366, 
         beta -> 0.878246, 
         tau0 -> 138.601, 
         const -> 0.351186} *)

fitted data

BUT!! (and this is a big but), can you justify that offset physically within your model?

$\endgroup$
4
  • $\begingroup$ MarcoB thank you very much! You are always so helpful with your answers. One quick question: Is there any way to get what you got without changing the value of deltaHinf?. For example, only by changing the values of beta, tau and perhaps a constant? $\endgroup$
    – John
    Commented Dec 22, 2020 at 20:49
  • 3
    $\begingroup$ @John No, there isn't. The point is: the value of $\Delta H_{inf}$ is the difference between the max and the min asymptotes (i.e. the value at high logt and the const in the model). The fact that the highest value is 2.28 in your data doesn't mean that this is the value of $\Delta H_{inf}$ unfortunately. If, on the other hand, $\Delta H_{inf}$ has to be equal to the value at highest logt, then we go back to the fact that this equation is not a good model for this dataset... $\endgroup$
    – MarcoB
    Commented Dec 22, 2020 at 21:36
  • $\begingroup$ Upvoted for the big but at the end! $\endgroup$
    – Dr. Andrew
    Commented Dec 23, 2020 at 7:39
  • 1
    $\begingroup$ Of course it's justified! See here $\endgroup$
    – user1066
    Commented Dec 23, 2020 at 9:41

Your Answer

By clicking “Post Your Answer”, you agree to our terms of service and acknowledge you have read our privacy policy.

Not the answer you're looking for? Browse other questions tagged or ask your own question.