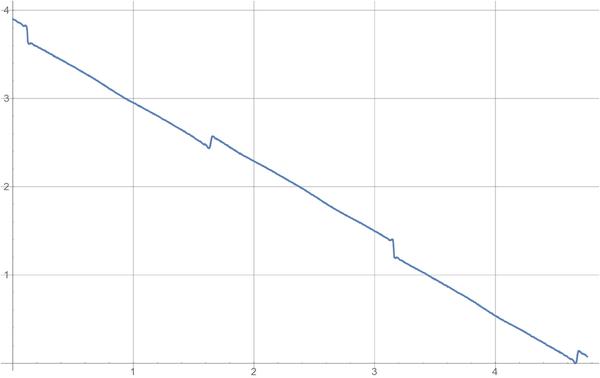
I have some data that when plotted I get an inclined graph, as described:
data = Import["p02q.dat", "Table"];

xdata = data[[All, 1]];
ydata = data[[All, 2]];

dataplot = Transpose[{xdata, ydata}];

plot2q = ListLinePlot[ dataplot, AspectRatio -> 1/GoldenRatio,
  ImageSize -> 800, PlotRange -> All, GridLines -> Automatic,
  InterpolationOrder -> 2, PlotMarkers -> {Automatic, 2}]
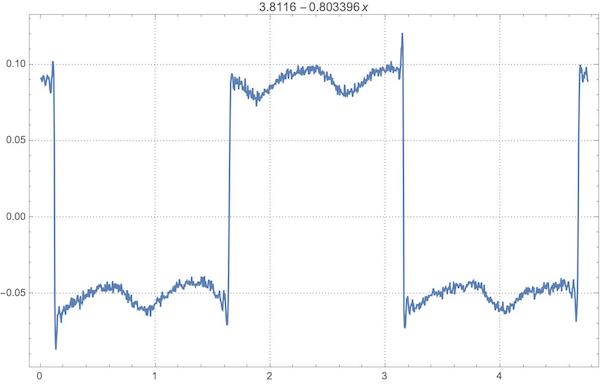
My intention is to get a leveled graph out of this one, like the one bellow:
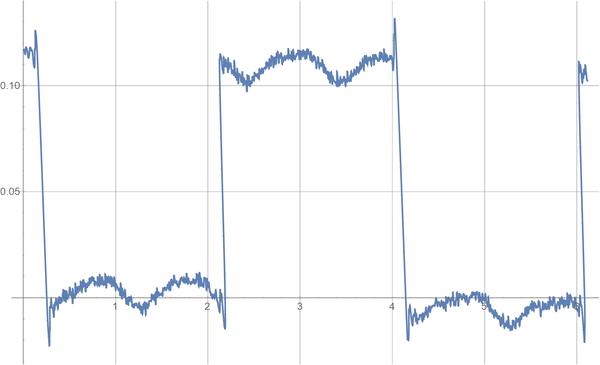
Could anyone suggest how to solve this, please? Data file can be downloaded here.

