2
$\begingroup$

Doing some mappings of the earth magnetic field results in the left-hand figure below (which consists of 181 profiles):
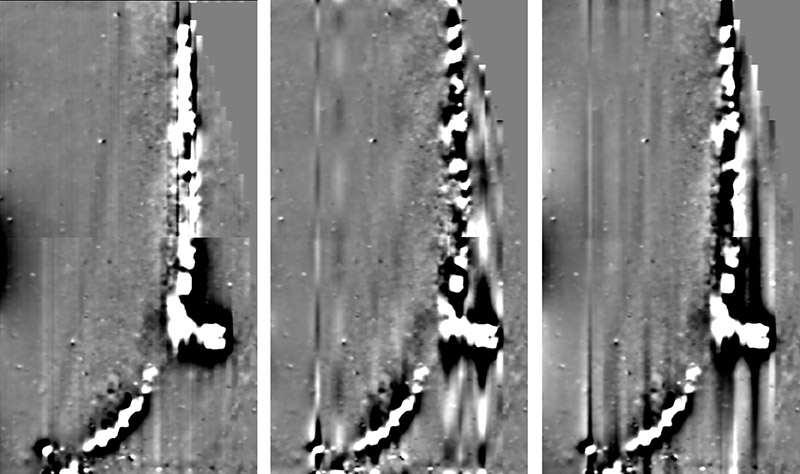
Non-linear trend reduction without threshold

To improve this I tried a non-linear trend reduction using, for example,

lm = LinearModelFit[data, {a, a^2,a^3,a^4,a^5,a^6,a^7,a^8,a^9},a];

(middle figure) and

lm = LinearModelFit[data, {a, a^2,a^3}, a];

(right-hand figure), respectively. Data was defined as data = Import[#1, "Table"]; within a Scan environment.

Because of the occurrence of artifacts I feel that I have to consider something like thresholds, so that the reduction will be only considered within a threshold (for example -20 <= t <= 20) and the data outside of this range should not be affected by these calculations.

I have no idea how to handle this effectively. My idea first was to use a lot of IF's and to separate each profile into several parts. But this will be ineffective and time-consuming...

I would like to handle all those 181 profiles separately before combining them.


@R.M.: This is the code I used so far:

SetDirectory[SystemDialogInput["Directory"]]
listOfFileNames = ReadList["listing.txt", Word];

Scan[
 (data = Import[#1, "Table"];
   newfile = StringReplace[#1, ".dat" -> "-red.dat"];
   wfile = OpenWrite[newfile, FormatType -> StandardForm];
   Clear[lm]; Clear[a]; Clear[neu]; Clear[aha]; 
   start = First[First[data]]; mdim = Length[data];
   lm = LinearModelFit[
     data, {a, a^2, a^3, a^4, a^5, a^6, a^7, a^8, a^9}, a];
   Do[aha = Last[Take[data, {m, m}]]; ywert = Last[aha]; 
    xwert = First[aha]; neu[m] = ywert - lm[xwert], {m, mdim}];
   Do[WriteString[newfile, start + (m - 1)*0.05  , "  "]; 
    Write[newfile,    neu[m]], {m, mdim}];
   Close[wfile];
   Clear;
   ) &,
 listOfFileNames
 ]

With listing.txt:

09500.dat 09525.dat 09550.dat 09575.dat 09600.dat 09625.dat 09650.dat 09675.dat etc


@belisarius:
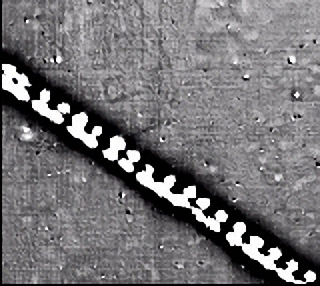
example 2

This shows the quality of data outside of the pipeline I want to achieve

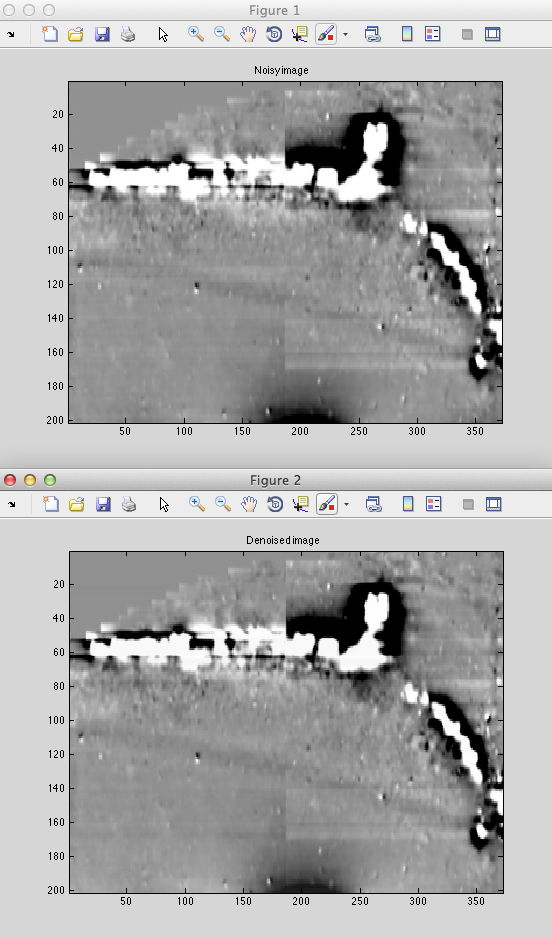
@Mr.Wizard: With VSNR there is no effect on the data: enter image description here
$\endgroup$
10
  • 1
    $\begingroup$ "To improve this" -- what does that mean in this context? $\endgroup$
    – Mr.Wizard
    Commented Jul 29, 2012 at 19:04
  • 2
    $\begingroup$ It is hard to think about this because it is muddled with a lot of domain specific details. Could you strip all of it to a basic minimal toy example (working)? $\endgroup$
    – rm -rf
    Commented Jul 29, 2012 at 19:06
  • $\begingroup$ there are small stripes (parallel to the direction of measurement, i.e. from bottom to the top) in the figure, which should be removed. The "background" (all the area outside of the strong anomaly) should be smoothed by this way, so when enhancing the contrast of the picture no small artefacts are disturbing the background. I have to enhance the contrast to be able to detect weak archaeological features, if there are any... $\endgroup$
    – Harald
    Commented Jul 29, 2012 at 19:12
  • $\begingroup$ Does this appear helpful? math.univ-toulouse.fr/~weiss/Codes/VSNR/… $\endgroup$
    – Mr.Wizard
    Commented Jul 29, 2012 at 19:42
  • $\begingroup$ Could you post an example of your expected result? $\endgroup$ Commented Jul 29, 2012 at 19:58

1 Answer 1

2
$\begingroup$

It's a shame there is no raw data to work with, since this is an interesting problem but quantization, resampling and jpeg compression have probably wiped out any subtle features that may have been present.

I think the basic idea outlined in the question is workable. The proposal is to high-pass filter each column of the image by fitting a polynomial with some small number of terms and subtracting the fit from the original data. The strong anomaly should be excluded from the fit. There is also a triangular region with no data in the top-right corner of the image, this should be excluded too.

We can also see that there is a clear separation between the top and bottom half of the image, so it makes sense to process both halves separately.

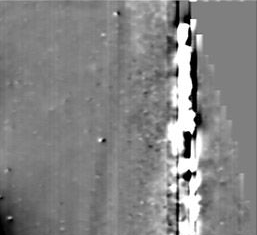
Starting from the image in the question, manually cropped to include only the left hand image:

Load the image, convert to grayscale and extract just the top half:

picture = ColorConvert[Import["cropped.jpg"], "Grayscale"];
image = ImageTake[picture, {2, 236}]

enter image description here

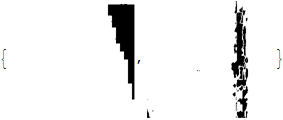
Using Binarize we can identify the regions with either no data (pixel values equal to 127/255) or where the anomaly is (pixel values close to 0 or 1)

nodata = ColorNegate[Binarize[image, {127/255, 127/255}]] ~ Dilation ~ 1;
anomaly = Binarize[image, {0.05, 0.95}];
{nodata, anomaly}

enter image description here

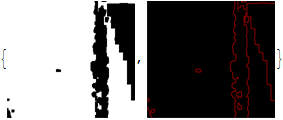
Combine the two regions using ImageMultiply (plus an Erosion to fill in the gaps a bit). I've also created an image showing the outline of the excluded regions.

mask = ImageMultiply[nodata, anomaly] ~ Erosion ~ 2;
edge = ImageApply[{#1, 0, 0} &, GradientFilter[mask, 1]];
{mask, edge}

enter image description here

Next convert the images to arrays and do the fits. I've used terms up to $x^{20}$. For each column, Pick is used to select the data which is not in the excluded region.

mask = ImageData @ mask;
image = ImageData @ image;

xvals = Range[0., 1, 1/(Length[mask] - 1)];

fit = Transpose @ Table[Fit[
      Pick[Transpose[{xvals, image[[All, j]]}], mask[[All, j]], 1],
      x^Range[0, 20], x] /. x -> xvals
    , {j, Length @ First @ image}];

The fitted data looks like this:

Image[fit]

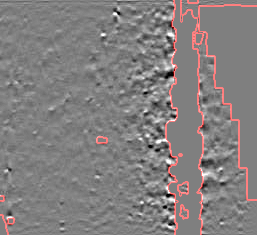
enter image description here

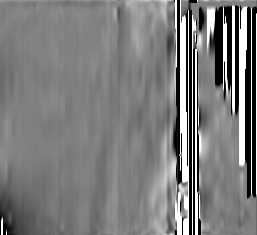
Subtracting the fitted data from the original image and enhancing the contrast:

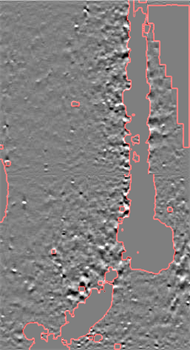
Image[0.5 + 3 (image - fit) mask] ~ ImageAdd ~ edge

enter image description here

If you repeat the process with the bottom half of the image and stack them together, you get this:

enter image description here

The strength of the filtering can be altered by using more or less terms in the fit.

$\endgroup$
1
  • $\begingroup$ Thanks a lot for your help. If you are interested, you can get the raw data via: dropbox.com/s/r7wnjb1nhx9drbz/ois.xyz - Harald. P.S.: z = 99999 are dummy values $\endgroup$
    – Harald
    Commented May 24, 2013 at 20:39

Your Answer

By clicking “Post Your Answer”, you agree to our terms of service and acknowledge you have read our privacy policy.

Not the answer you're looking for? Browse other questions tagged or ask your own question.