5
$\begingroup$

I have two sets of 2d-data points which can be transformed in each other by using a certain transformation function.

The problem is that in both data sets there are points which do not have associated points in the other list.

data1 = 
{
{33.9168, 631.006}, {48.8067, 673.198}, {3.59394, 671.167},
{64.1931, 632.506}, {58.7559, 613.401}, {5.45129, 635.602}, 
{40, 500}, {55.6619, 651.298}, {40, 850}, {18.1513, 671.949},
{54.6781, 598.251}, {23.5348, 608.289}, {65.0549, 531.442},
{74.4132, 479.425}, {32.9808, 671.931}, {46.4516, 750.192},
{26.9262, 650.35}, {27.1816, 413.334}, {20.3858, 633.391}, 
{50.9284, 770.49}, {64.1628, 670.801}, {13.1805, 652.588}, 
{41.4876, 650.752}, {82.9996, 514.631}, {36.0045, 612.007},
{26.4914, 548.723}, {58.3295, 458.015}, {21.557, 801.607}, 
{5.84689, 800.425}
};

data2 = 
{
{1532.93, 536.587}, {1514.13, 789.}, {1530.22, 596.423}, 
{1520.66, 640.844}, {1540.5, 660.237}, {1530.03, 790.2}, 
{1559.17, 758.9}, {1556.15, 661.154}, {1580.39, 467.111}, 
{1525.63, 660.167}, {1571.44, 620.556}, {1512.62, 623.985}, 
{1520, 500}, {1533.79, 638.607}, {1526.88, 621.69}, 
{1560.9, 586.053}, {1572.13, 658.656}, {1548.37, 638.933}, 
{1532.8, 400.935}, {1540.44, 618.794}, {1590.15, 501.882}, 
{1554.5, 738.5}, {1564.73, 445.615}, {1543.06, 600.093}, 
{1565.69, 601.532}, {1562.55, 639.132}, {1511.34, 659.395}, 
{1580, 400}, {1585, 700}, {1571.9, 519.25}
};

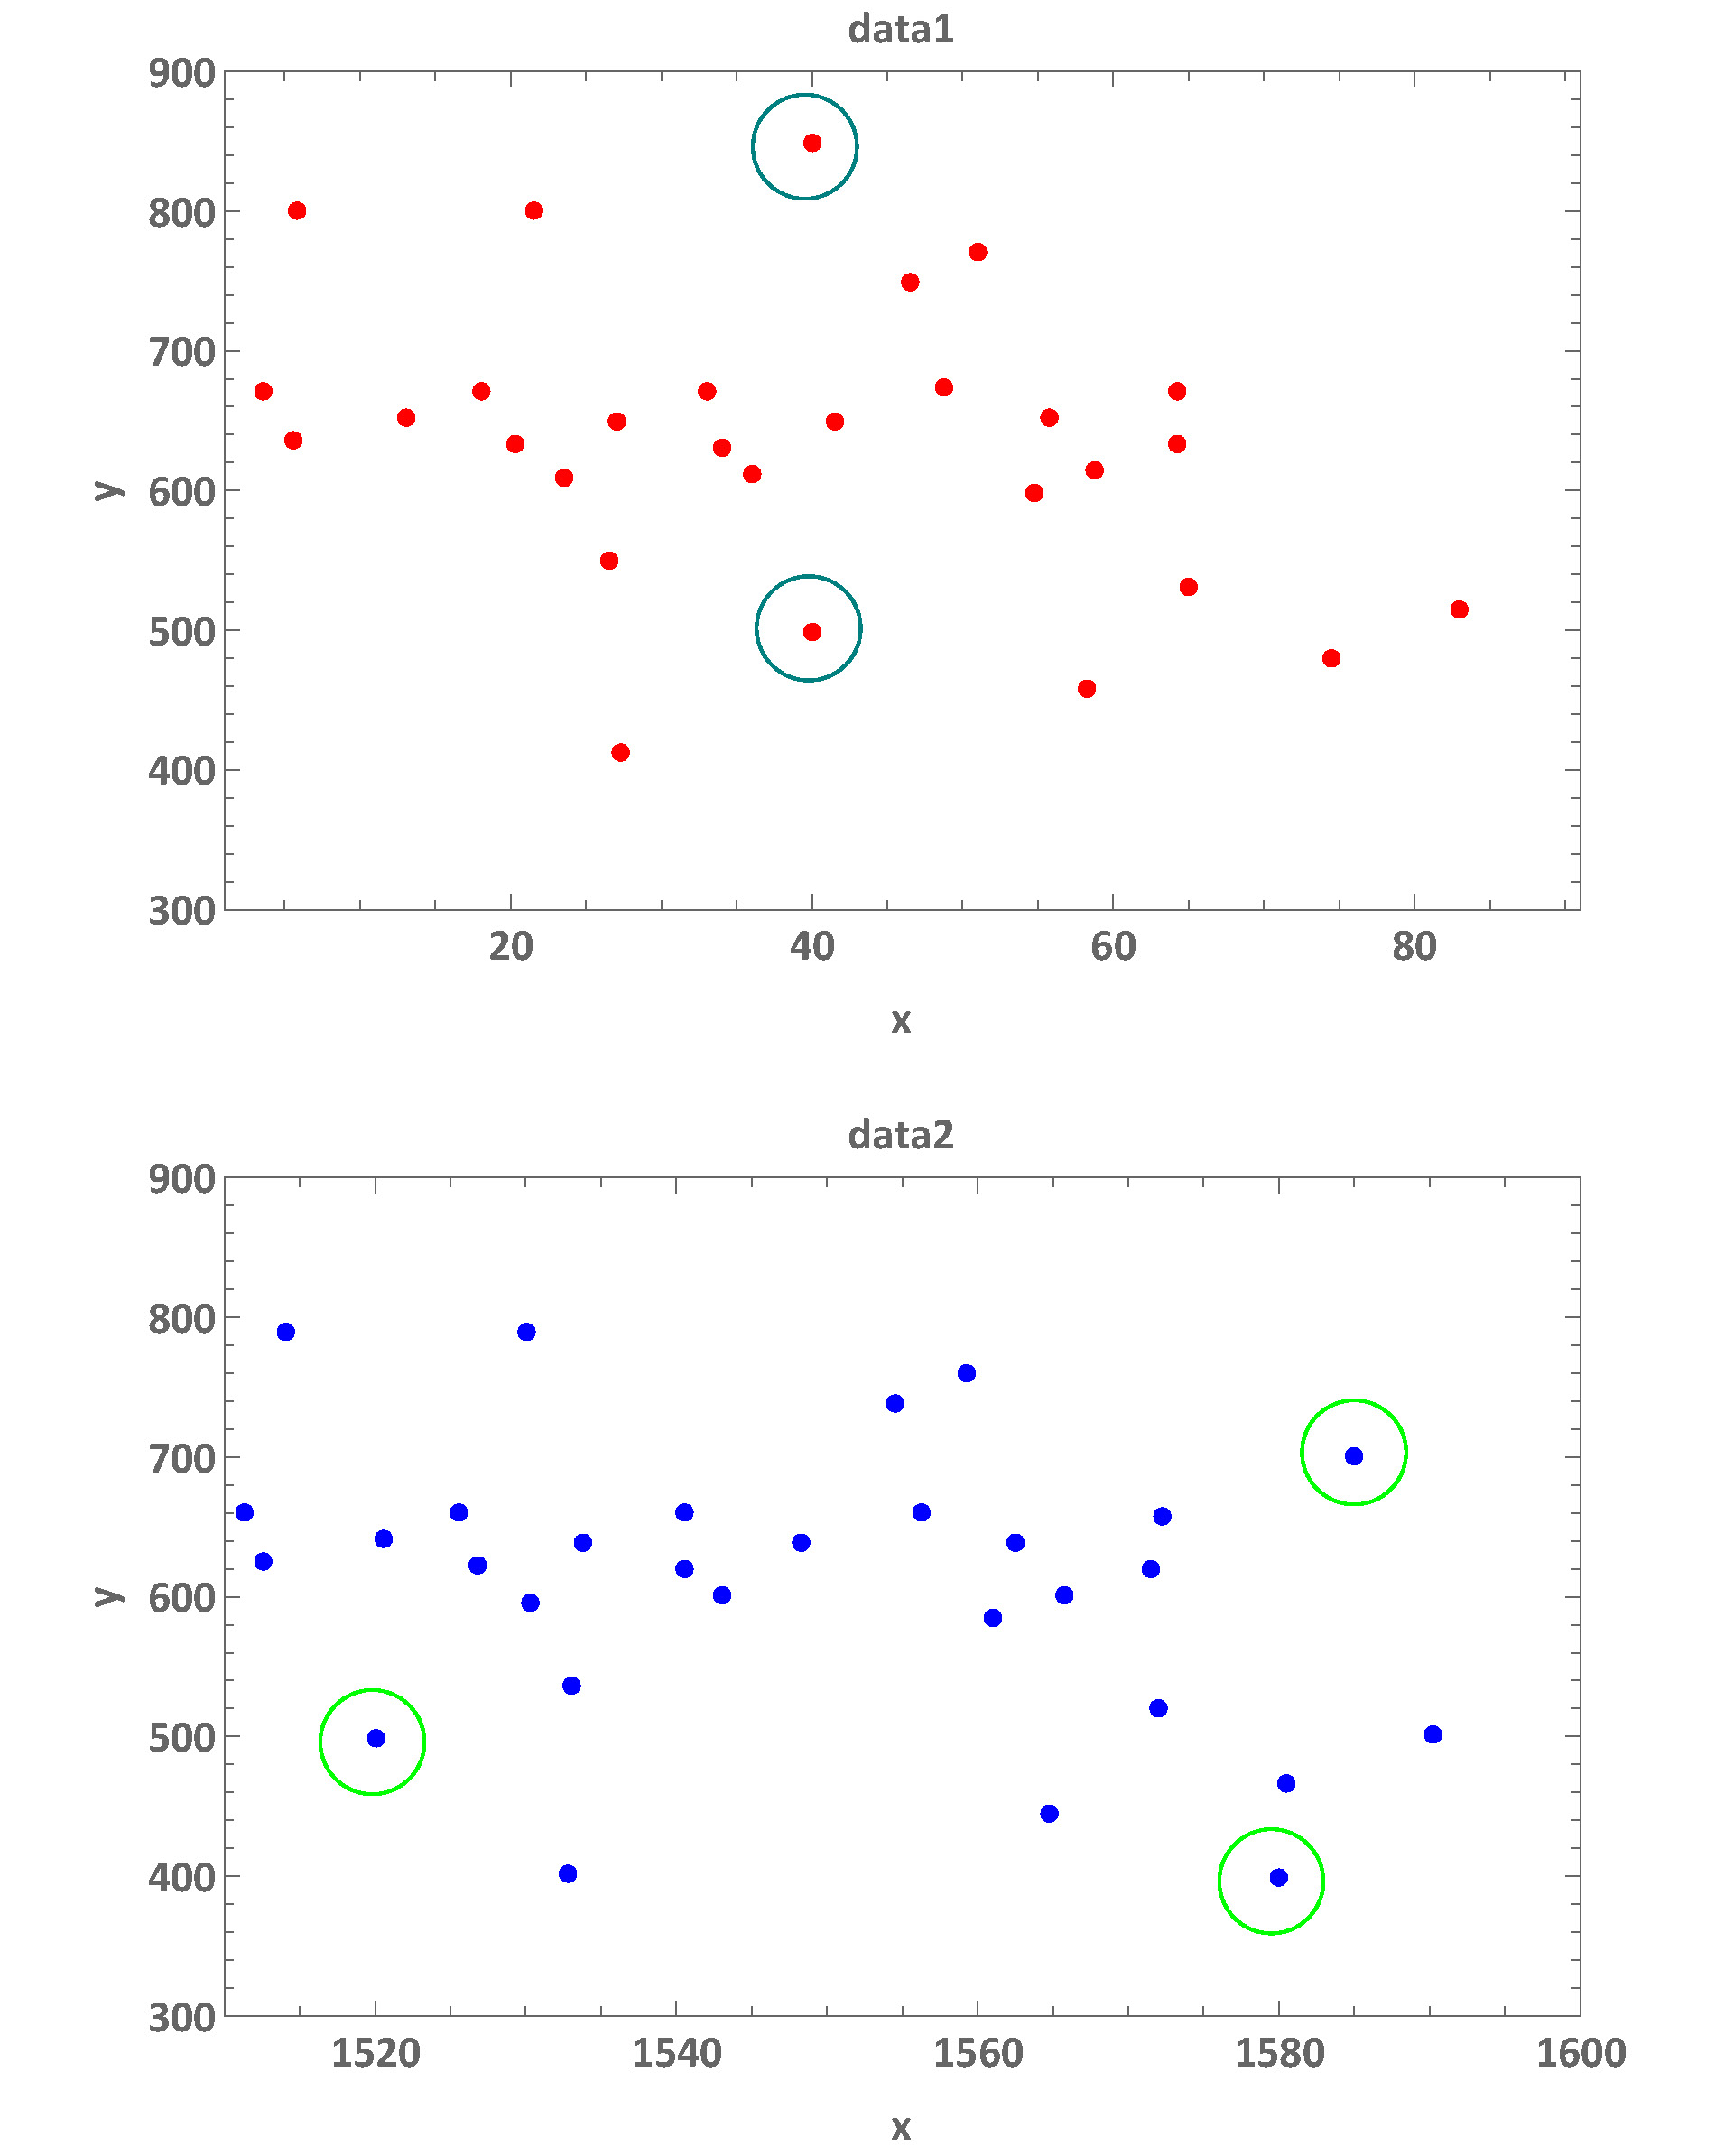
enter image description here

In the upper plots I have marked these particular points.

I have two questions

  1. How can I remove these marked non-associated points?

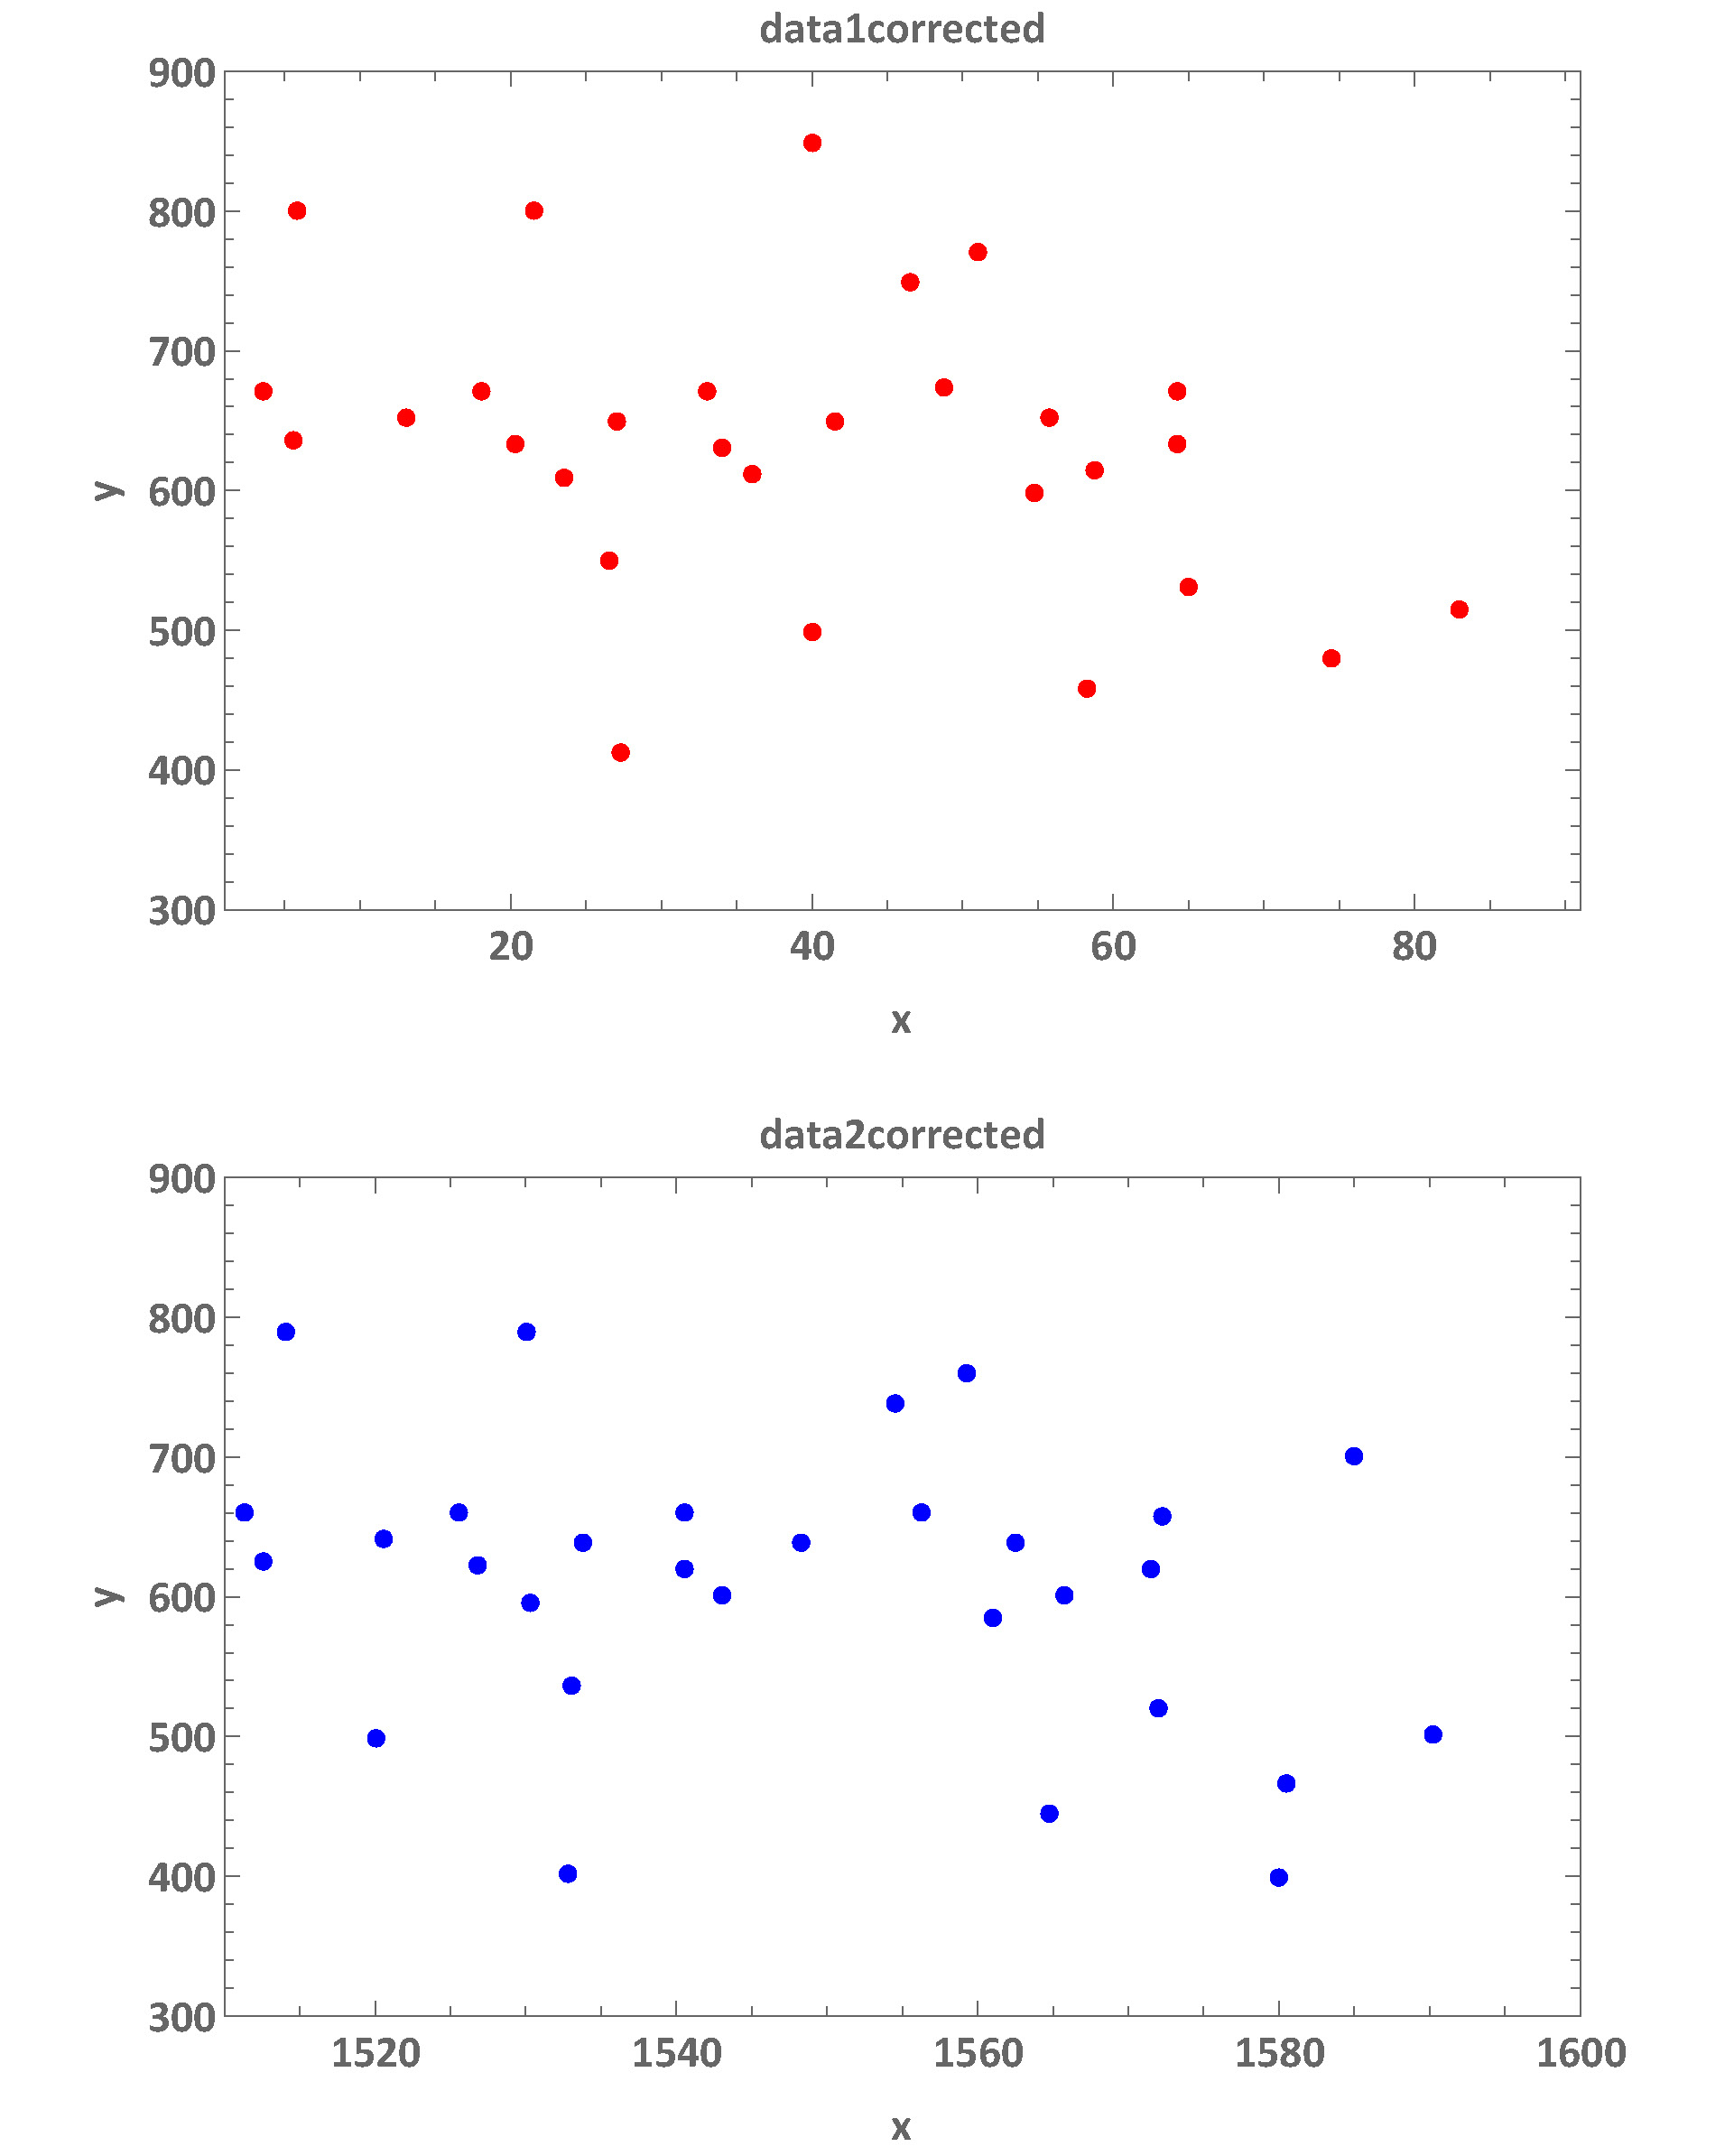
  2. How can I sort the remaining points (in data1corrected and data2corrected, see below) in such a way that the first point of data1corrected is corresponding to the first point data2corrected and so on.

For question 1 I think I should calculate all the point-distances of data1 and then separately of data2. I expect it should be possible to find from this distances-information the additional anomalous points and remove them.

The distance from each point to another point of data1corrected is aproximately the same as for the points of data2corrected.

For question 2 I have no idea.

I wish then to receive e.g. for the corrected lists:

data1corrected=
{
{21.557, 801.607}, {5.84689, 800.425}, {50.9284, 770.49}, 
{46.4516, 750.192}, {32.9808, 671.931}, {48.8067, 673.198}, 
{3.59394, 671.167}, {18.1513, 671.949}, {64.1628, 670.801}, 
{13.1805, 652.588}, {55.6619, 651.298}, {26.9262, 650.35}, 
{41.4876, 650.752}, {5.45129, 635.602}, {20.3858, 633.391}, 
{64.1931, 632.506}, {33.9168, 631.006}, {58.7559, 613.401}, 
{36.0045, 612.007}, {23.5348, 608.289}, {54.6781, 598.251}, 
{26.4914, 548.723}, {65.0549, 531.442}, {82.9996, 514.631}, 
{74.4132, 479.425}, {58.3295, 458.015}, {27.1816, 413.334}
};

data2corrected=
{
{1530.03, 790.2}, {1514.13, 789.}, {1559.17, 758.9}, 
{1554.5, 738.5}, {1540.5, 660.237}, {1556.15, 661.154}, 
{1511.34, 659.395}, {1525.63, 660.167}, {1572.13, 658.656}, 
{1520.66, 640.844}, {1562.55, 639.132}, {1533.79, 638.607},     
{1548.37, 638.933}, {1512.62, 623.985}, {1526.88, 621.69},   
{1571.44, 620.556}, {1540.44, 618.794}, {1565.69, 601.532}, 
{1543.06, 600.093}, {1530.22, 596.423}, {1560.9, 586.053}, 
{1532.93, 536.587}, {1571.9, 519.25}, {1590.15, 501.882}, 
{1580.39, 467.111}, {1564.73, 445.615}, {1532.8, 400.935}
};

enter image description here

$\endgroup$
6
  • 3
    $\begingroup$ How do you know which points should be removed? How did you find them? $\endgroup$ Commented Jan 16, 2019 at 11:45
  • $\begingroup$ @Alex Trounev: Without the points wihich should be removed you can see from the uppermost two plots that the points of data1 (red) and data2 (blue) are scattered in the same "structure" with nearly same distances among each other in data1 and data2. In the example data2 are shifted to higher x coordinates and have also a small shift in y direction. The marked points have no "associated" partner points in the two plots. The shift in x and y could be also of the same size. $\endgroup$
    – mrz
    Commented Jan 16, 2019 at 12:07
  • 3
    $\begingroup$ Maybe rescale to have ommon x axes and then use Complement with some SameTest to allow for modest numeric differences? $\endgroup$ Commented Jan 16, 2019 at 15:55
  • $\begingroup$ @Daniel Lichtblau: yes the distances between all points of data1 and of data2 should a measure to find and remove the marked points. Do you mean that? $\endgroup$
    – mrz
    Commented Jan 16, 2019 at 16:17
  • 1
    $\begingroup$ Basically yes. Could use Nearest functions from each set, checking that items in the other set come "close enough" to not be deleted as non-associates. $\endgroup$ Commented Jan 16, 2019 at 17:26

2 Answers 2

6
$\begingroup$

With the next three commands we rescale the data:

mmy = MinMax[Join[data1, data2][[All, 2]]];
rdata1 = Transpose[{Rescale[data1[[All, 1]]], Rescale[data1[[All, 2]], mmy, {0, 1}]}];
rdata2 = Transpose[{Rescale[data2[[All, 1]]], Rescale[data2[[All, 2]], mmy, {0, 1}]}];

Next we find the non-corresponding points as outliers of distances. (Using the package OutlierIdentifiers.m.)

Import["https://raw.githubusercontent.com/antononcube/MathematicaForPrediction/master/OutlierIdentifiers.m"]

To be more precise:

  1. for each point p of the rescaled first dataset we find the distances from p to each point of the rescaled second dataset;

  2. we find the minimum distance for each p;

  3. we find the outliers with the obtained set of minimum distances;

  4. we evaluate the found outliers to finally decide which points of the first dataset do not have associated points in the second dataset.

The procedure above is repeated with the roles of the two datasets reversed.

For the first dataset:

dists12 = Min /@ Outer[EuclideanDistance, rdata1, rdata2, 1];
pos12 = OutlierPosition[dists12, SPLUSQuartileIdentifierParameters]
dists12[[pos12]]

(* {7, 9, 18} *)

(* {0.201649, 0.251023, 0.0370386} *)

For the second dataset:

dists21 = Min /@ Outer[EuclideanDistance, rdata2, rdata1, 1];
pos21 = OutlierPosition[dists21, SPLUSQuartileIdentifierParameters]
dists21[[pos21]]

(* {13, 19, 28, 29} *)

(* {0.208751, 0.0370386, 0.177705, 0.183716} *)

Note that some of the found outliers might not be considered outliers -- edit pos12 and pos21 accordingly.

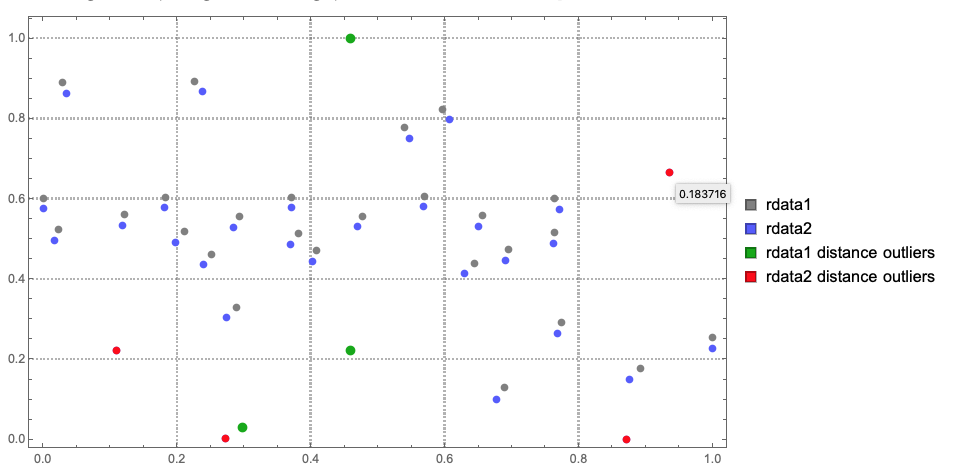
Here we plot the rescaled data and the found outliers (notice the tooltips):

ListPlot[{rdata1, rdata2, 
  MapThread[Tooltip, {rdata1[[pos12]], dists12[[pos12]]}], 
  MapThread[Tooltip, {rdata2[[pos21]], dists21[[pos21]]}]}, 
 PlotStyle -> {Gray, Lighter[Blue], {Darker[Green], PointSize[0.014]}, Red}, 
 PlotLegends -> SwatchLegend[{"rdata1", "rdata2", "rdata1 distance outliers", "rdata2 distance outliers"}],
 PlotRange -> All, ImageSize -> Large, PlotTheme -> "Detailed"]

enter image description here

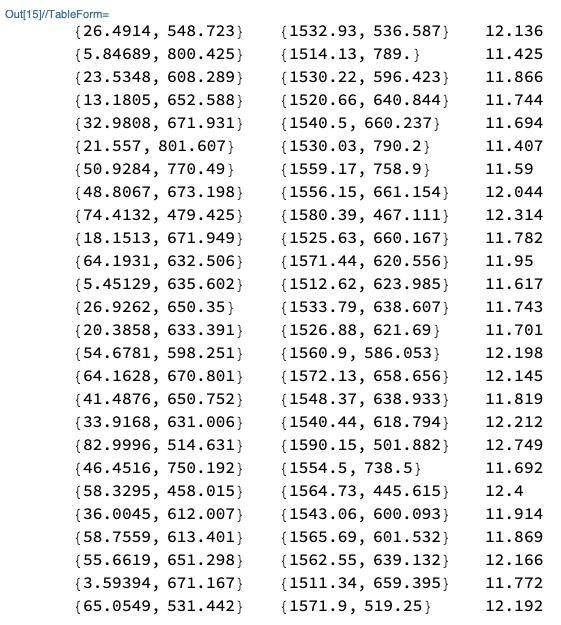
Next we find the nearest points of the first dataset to any point from the second dataset using Nearest:

 nn1 = Nearest[rdata1 -> Range[Length[rdata1]]];

Tabulate the corresponding points after removing the outliers of second dataset (compare the y-coordinates):

Block[{cleanInds2 = Complement[Range[Length[data2]], pos21], pairs},
 pairs = Transpose[{data1[[First[nn1[#]] & /@ rdata2[[cleanInds2]]]], data2[[cleanInds2]]}];
 TableForm[Map[Append[#, EuclideanDistance @@ #[[All, 2]]] &, pairs], TableDepth -> 2]
]

enter image description here

$\endgroup$
1
  • $\begingroup$ For testing your solution I have changed the position of the old 2 outliers in data1 and the 3 outliers in data2. The modified 2 points for data1 are now {42, 670}, {40, 650} and the 3 points for data2are {1570, 750}, {1575, 480}, {1518, 650}. Please see also pastebin.com/raw/WGjKj8ST (I have randomized the order). Why are now the added points {40, 650} corresponding to {1548.37, 638.933}and also {13.1805, 652.588} is corresponding to {1518, 650}? $\endgroup$
    – mrz
    Commented Jan 18, 2019 at 10:55
5
$\begingroup$
data1 = {{33.9168, 631.006}, {48.8067, 673.198}, {3.59394, 
    671.167}, {64.1931, 632.506}, {58.7559, 613.401}, {5.45129, 
    635.602}, {40, 500}, {55.6619, 651.298}, {40, 850}, {18.1513, 
    671.949}, {54.6781, 598.251}, {23.5348, 608.289}, {65.0549, 
    531.442}, {74.4132, 479.425}, {32.9808, 671.931}, {46.4516, 
    750.192}, {26.9262, 650.35}, {27.1816, 413.334}, {20.3858, 
    633.391}, {50.9284, 770.49}, {64.1628, 670.801}, {13.1805, 
    652.588}, {41.4876, 650.752}, {82.9996, 514.631}, {36.0045, 
    612.007}, {26.4914, 548.723}, {58.3295, 458.015}, {21.557, 
    801.607}, {5.84689, 800.425}};

I'll copy the data for completeness.

data2 = {{1532.93, 536.587}, {1514.13, 789.}, {1530.22, 
    596.423}, {1520.66, 640.844}, {1540.5, 660.237}, {1530.03, 
    790.2}, {1559.17, 758.9}, {1556.15, 661.154}, {1580.39, 
    467.111}, {1525.63, 660.167}, {1571.44, 620.556}, {1512.62, 
    623.985}, {1520, 500}, {1533.79, 638.607}, {1526.88, 
    621.69}, {1560.9, 586.053}, {1572.13, 658.656}, {1548.37, 
    638.933}, {1532.8, 400.935}, {1540.44, 618.794}, {1590.15, 
    501.882}, {1554.5, 738.5}, {1564.73, 445.615}, {1543.06, 
    600.093}, {1565.69, 601.532}, {1562.55, 639.132}, {1511.34, 
    659.395}, {1580, 400}, {1585, 700}, {1571.9, 519.25}};

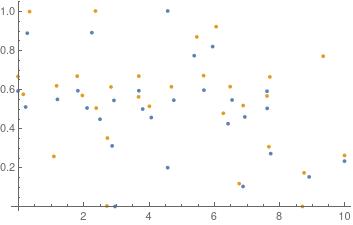
Rescale to have x axis from 0 to 10, y axis from 0 to 1. The point is to penalize for x differences more than y differences.

scale = 10;
data1a = SortBy[data1, First];
{min1, max1} = MinMax[data1a[[All, 2]]];
data1b = Map[{scale (#[[1]] - data1a[[1, 1]])/(data1a[[-1, 1]] - 
         data1a[[1, 1]]), (#[[2]] - min1)/(max1 - min1)} &, data1a];
data2a = SortBy[data2, First];
{min2, max2} = MinMax[data2a[[All, 2]]];
data2b = Map[{scale (#[[1]] - data2a[[1, 1]])/(data2a[[-1, 1]] - 
         data2a[[1, 1]]), (#[[2]] - min2)/(max2 - min2)} &, data2a];

Here is how they look together.

ListPlot[{data1b, data2b}]

enter image description here

Form nearest functions for each. We could investigate distances to nearest neighbors, or make sure no index is required twice, etc. I do not actually make use of that.

nf1 = Nearest[data1b -> {"Index", "Distance"}];
nf2 = Nearest[data2b -> {"Index", "Distance"}];

Arbitrary cut-off: distance > 0.25.

distances1 = nf1[data2b, {Infinity, .25}];
distances2 = nf2[data1b, {Infinity, .25}];

Now check which indices in each set fail to have a sufficiently close neighbor.

Flatten[Position[distances1, {}]]
Flatten[Position[distances2, {}]]

(* Out[455]= {4, 27, 29}

Out[456]= {15, 16} *)

Automating this could be problematic since criteria might vary (how close on the x axis, how close on the y axis, which to remove when a closest neighbor is shared, etc.)

$\endgroup$
5
  • $\begingroup$ Thank you for the solution. Same comment as to Anton Antonov: Can you please show two data sets in which your code would fail, just that I understand where the limits are. E.g.: Would your code be able to find the outliers in such an example: i.imgur.com/K75oeID.jpg $\endgroup$
    – mrz
    Commented Jan 17, 2019 at 18:26
  • 1
    $\begingroup$ If you post the data sets I can try it. Regardless, clearly there will be thresholds for which one might want different behavior from what this will deliver. $\endgroup$ Commented Jan 17, 2019 at 19:00
  • $\begingroup$ Would it be more stable to use instead of the distance the translation in x and y direction between data1 and data2as a measure to find associated points (imagine the displacement in data1 and data2 would be approximately the same)? $\endgroup$
    – mrz
    Commented Jan 18, 2019 at 8:28
  • $\begingroup$ For testing your solution I have changed the position of the old 2 outliers in data1 and the 3 outliers in data2. The modified 2 points for data1 are now {42, 670}, {40, 650} and the 3 points for data2are {1570, 750}, {1575, 480}, {1518, 650}. Please see also pastebin.com/raw/WGjKj8ST (I have randomized the order). I can play with the cut-off values but I am never able to find only these new outliers. $\endgroup$
    – mrz
    Commented Jan 18, 2019 at 10:58
  • 1
    $\begingroup$ Yes, a different way to associate points might well be more stable. $\endgroup$ Commented Jan 18, 2019 at 17:01

Your Answer

By clicking “Post Your Answer”, you agree to our terms of service and acknowledge you have read our privacy policy.

Not the answer you're looking for? Browse other questions tagged or ask your own question.