8
$\begingroup$

OK, let's create a simple closed curve

C0 = ContourPlot[x^2/4 + y^2/9 == 1, {x, -5, 5}, {y, -5, 5}];

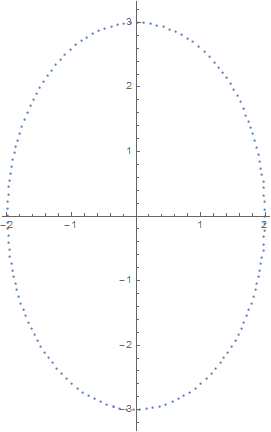
and let's plot the corresponding points

data = C0[[1, 1]];
S0 = ListPlot[{data}] 

enter image description here

Now I want to be able to create a new list, data2 containing N points of the curve. These N points should not be random but have equal distances from each other. Any suggestions?

Two important notes:

(1). The above ellipse is just a simple scenario. The real data file corresponds to a closed curve with unknown implicit function. So, the suggested solution should not take into account the particular function. Only data is known.

(2). If we assume that data contains N0 points (on our example N0 = 200) the solution should also work for N > N0.

A good starting point would be to find a solution in our example when N = 100 and when N = 300, taking always into account the two above-mentioned important notes.

Many thanks in advance.

EDIT

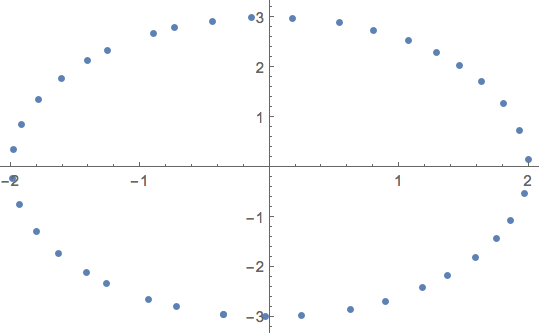
Using @gpap approach for N = 100 the output is the following

enter image description here

Aw we can see the points are not equally spaced.

$\endgroup$
4
  • $\begingroup$ See How do I split up a curve into chords of equal length?, Generating evenly spaced points on a curve $\endgroup$
    – user9660
    Commented Oct 5, 2015 at 9:01
  • $\begingroup$ @Lou All the answers in the suggested link take into account the function of the closed curve. However in my case the function is unknown. $\endgroup$
    – Vaggelis_Z
    Commented Oct 5, 2015 at 9:04
  • $\begingroup$ I was gonna say the first of the links from @Lou is more appropriate if you want the equal segments along the curve rather than each coordinate. Neither of these answers is specific to closed curves. $\endgroup$
    – gpap
    Commented Oct 5, 2015 at 9:12
  • $\begingroup$ It may be a bit of a stretch, but this might be considered a duplicate: mathematica.stackexchange.com/questions/21993/… $\endgroup$
    – Michael E2
    Commented Oct 5, 2015 at 12:24

5 Answers 5

8
$\begingroup$

Borrowing from one of Vitaliy Kaurov's answers to Generating evenly spaced points on a curve, here is a way to get 100 points. Change the setting to Mesh to get a different number.

plot = ContourPlot[x^2/4 + y^2/9 == 1, {x, -5, 5}, {y, -5, 5}, 
  MeshFunctions -> {"ArcLength"}, Mesh -> 100];

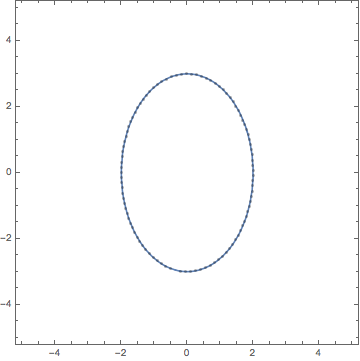
Mathematica graphics

Cases[Normal@plot, Point[p_] :> p, Infinity]
(*
  {{-0.505748, -2.89977}, {-0.648738, -2.83537},
   ...
   {-0.0474628, -2.99777}, {-0.203681, -2.98306}
*)

Or, if the data is "given" -- i.e., we do not have the function from ContourPlot -- then interpolating the curve, as LLlAMnYP does, and plotting can work:

sifn = Interpolation[
   MapIndexed[{#2 - 1, #1} &,
    data[[First@FindCurvePath[data]]]
    ],
   PeriodicInterpolation -> True];

plot = ParametricPlot[sifn[t], {t, 0, 200}, 
   MeshFunctions -> {"ArcLength"}, Mesh -> 100
   ];
Cases[Normal@plot, Point[p_] :> p, Infinity]
$\endgroup$
0
8
$\begingroup$

Given that a list of points might be viewed a polygonal path, my answer to Equidistant points on a polyline may be applied here:

With[{loop = Append[data, First@data], n = 100},
 arclengths = Accumulate[Norm /@ Differences@loop];
 pfn = Interpolation[
   Transpose@{List /@ Rescale@Prepend[arclengths, 0.], loop}, 
   InterpolationOrder -> 1, PeriodicInterpolation -> True];

 Show[
  C0, Graphics[{Red, Point[pfn@Subdivide[n - 1]]}]
  ]
 ]

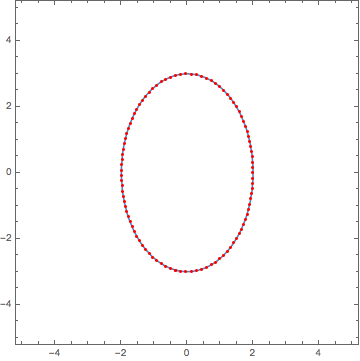
Mathematica graphics

$\endgroup$
7
$\begingroup$

Here's a very inefficient way. Generate an interpolation:

ifunc = Interpolation@MapIndexed[{First@#2,#1}&,data]

Oversample the data:

datafine = ifunc/@Range[1,Length@data,.1];

Use a rather inefficient replacement rule:

datafiltered = datafine //. {h___List, a_List, b_List, t___List} :>
                            {h, a, t} /; Norm[a - b] < 0.1;

Plot with correct aspect ratio:

ListPlot[datafiltered, AspectRatio -> Automatic]

image

$\endgroup$
2
  • $\begingroup$ Where do you control the number of points? $\endgroup$
    – Vaggelis_Z
    Commented Oct 5, 2015 at 10:05
  • $\begingroup$ @Vaggelis_Z This is an inexact method, I'm afraid. It makes sure, that the distance between consecutive points in the resulting list is closest to 0.1 "from above", but does not offer control otherwise. It does offer roughly equal spacing. I'll see how this can be improved. $\endgroup$
    – LLlAMnYP
    Commented Oct 5, 2015 at 10:08
7
$\begingroup$

You can resample each list of coordinates (if you undersample with respect to the fine details of the curve, this won't work as well):

points=40;
newList=Transpose[ArrayResample[#, points] & /@ Transpose@data];
ListPlot@newList

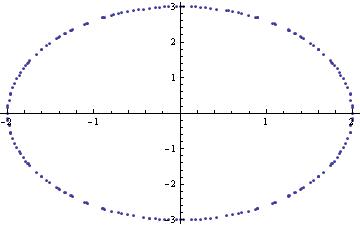
enter image description here

Alternatively, you can use the MeshFunctions option of ListLinePlot.

---EDIT---

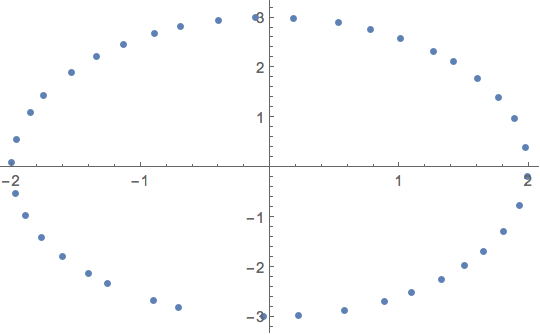
Initially I thought that #3 is just arc length but it is not the case as you pointed out. I noticed @MichaelE2 has a named mesh function {"ArcLength"} so this works here just as well(I am not sure it will on v9 though). You still need to add a point manually:

newList2=Cases[ListLinePlot[data, MeshFunctions -> {"ArcLength"}, Mesh -> points][[1]] // Normal, Point[a_] :> a, Infinity];
ListPlot@newList2

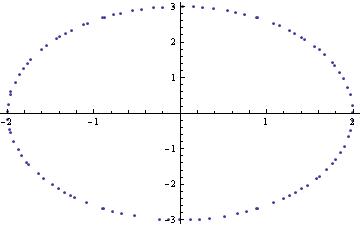
enter image description here

$\endgroup$
5
  • $\begingroup$ It seems to work fine. However I use v9 of Mathematica and ArrayResample is not recognized. Any alternative? $\endgroup$
    – Vaggelis_Z
    Commented Oct 5, 2015 at 9:12
  • $\begingroup$ the edit would work I think $\endgroup$
    – gpap
    Commented Oct 5, 2015 at 9:24
  • $\begingroup$ See my edit for N = 100. Also you use MeshStyle -> Red however I don't see anything in red. $\endgroup$
    – Vaggelis_Z
    Commented Oct 5, 2015 at 9:30
  • $\begingroup$ Yeah, disregard the red bit, I was gonna select the red points but the I realised if I use list line plot I don't need to $\endgroup$
    – gpap
    Commented Oct 5, 2015 at 9:43
  • $\begingroup$ Any ideas on how to produce points with equal distance with each other? I think that your approach is in the right path. Only this is left so as to approve your solution. $\endgroup$
    – Vaggelis_Z
    Commented Oct 5, 2015 at 9:46
3
$\begingroup$

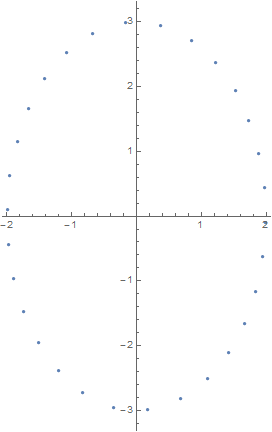
Here's a different approach. It's similar to a post that was just written, then deleted (by Michael_E2, I think). Let's get a cyclic interpolation of the data:

ifunc = Interpolation[({{0, Last@data}}~Join~
    MapIndexed[{First@#2, #1} &, data]), 
  PeriodicInterpolation -> True]
{sol} = NDSolve[g'[t] == Norm[D[fun[t], t]] && g[1] == 0, g, {t, 0, 200}];

This is assuming, we are dealing with a closed curve. g appears to be roughly linear, this is exploited in selecting the starting value in the following FindRoot command:

tvals = t /. 
   With[{n = 30, g = g /. sol}, 
    FindRoot[g[t] == #, {t, 200/g[200]*#}] & /@ 
     Range[g[200]/n, g[200], g[200]/n]] // Quiet;

Using this...

ListPlot[(ifunc /@ tvals), AspectRatio -> Automatic]

image

$\endgroup$
3
  • $\begingroup$ Sorry for the confusion. I was working on the answer similar to your first (at the same time as you), when I thought it was simplier to apply Vitaliy's MeshFunctions trick directly to the ContourPlot. Then I realized that probably, the OP has only the points... $\endgroup$
    – Michael E2
    Commented Oct 5, 2015 at 10:37
  • $\begingroup$ No problem, I actually borrowed the Prepend and PeriodicInterpolation from you when I got a glimpse at your post, and for sure I upvote an approach near-identical to mine :) $\endgroup$
    – LLlAMnYP
    Commented Oct 5, 2015 at 10:39
  • $\begingroup$ Near-identical was an overstatement, I concede. $\endgroup$
    – LLlAMnYP
    Commented Oct 5, 2015 at 10:42

Your Answer

By clicking “Post Your Answer”, you agree to our terms of service and acknowledge you have read our privacy policy.

Not the answer you're looking for? Browse other questions tagged or ask your own question.