I'm really keen to see the ideas of other people. Nevertheless, I want to show want I came up with. The approach I show here is hopefully general enough to be used in many situations, but I will use the aforementioned Dracula theme as example.
What I took as basis for this approach was the background color of the editor window. Now I considered several things
What never liked is high contrast, for instance white font-color on black background. This clearly hurts my eyes and I could look on the screen for long. Btw, here on Mathematica.SE we have gray text-color too. What I try to achieve is an overall text brightness which is as bright as possible without blinding me (I'm not sure whether blinding is the right word.
The main highlighting colors should be of the same brightness. All of them! If a color is brighter it draws more attention which is not wanted because we already have colors to draw attention.
The colors should have a certain difference feeling when you look at them. What I use here is the following: when you sort the colors, the difference between two neighboring colors feel equal throughout the palette.
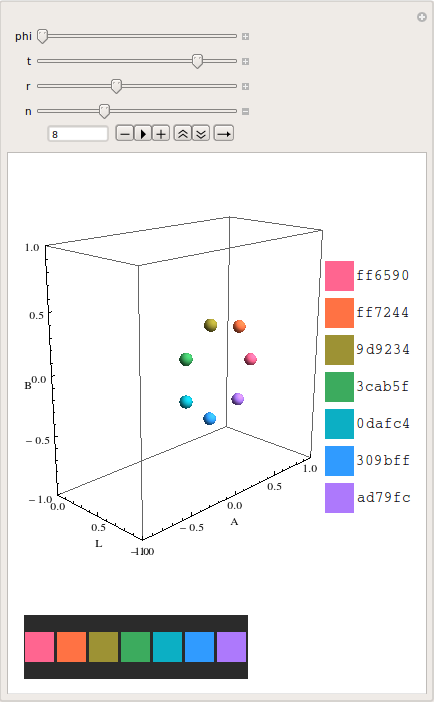
With this in mind, I wrote a small Manipulate which uses the "LAB" color-space to create a set of colors. The advantage of "LAB" is that it is perceptual uniform which means that distances in the color-space are correlated to the perceptual differences. With this, we can easily create highlighting colors, where no color is perceptually preferred.
Long story short: In the following vb is the "LAB" value of IDEA's background color. t controls the brightness. If if is 1, we have the same brightness as the background-color. n creates a circle of n-1 color-points which are located around vb*t with a radius of r. With phi you can adjust the color-point positions.

The visualization gives a Graphics3D showing the color-points in the "LAB" space, a bar with html color codes attached and a preview with background.
Using this, I started at the background color and chose the foreground color of the text first. Then I adjusted r to how colorful I wanted the colors to be.
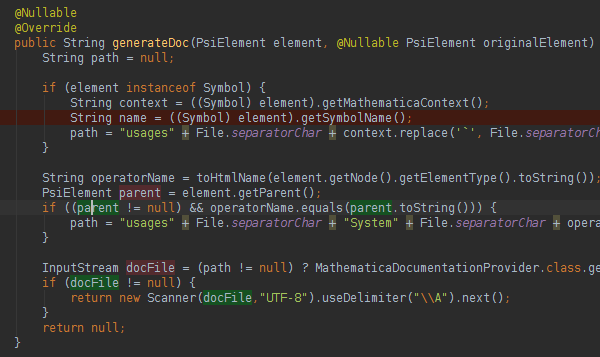
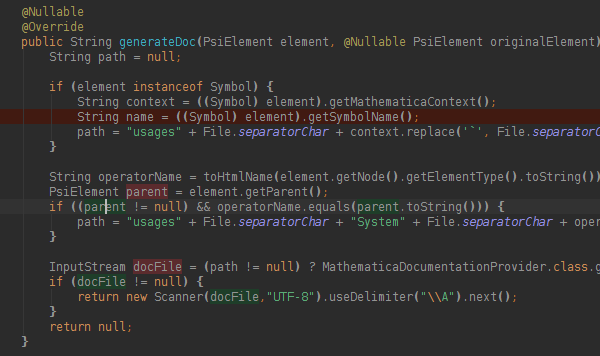
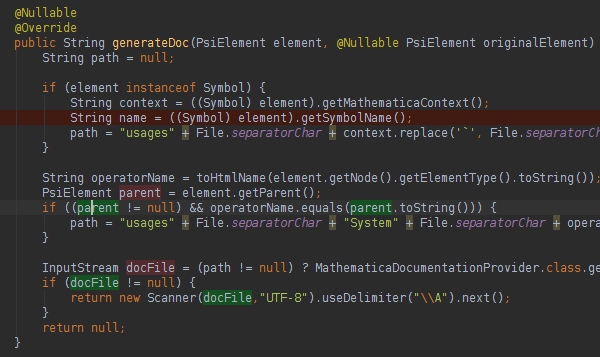
Using this I came up with the following (first the original colors, then the adjusted ones). The differences are very subtle but I think the result is more consistent because of the equal brightness.


Here the code
Manipulate[
 Module[{
   data =
    Table[r {0, Cos[phi], Sin[phi]}, {phi, 0, 2 Pi - 2 Pi/(n - 1),
      2 Pi/(n - 1)}],
   vb = {0.481, 0, 0}, trans, toHtml},
  trans[phi_, v_, pt_] :=
   Composition[TranslationTransform[v],
     RotationTransform[phi, {1, 0, 0}]][pt];
  toHtml[rgb_List] := StringJoin[IntegerString[Round[255 rgb], 16, 2]];
  Column[{
    Row[{
      Graphics3D[{RGBColor@
           ColorConvert[trans[phi, t vb, #], "LAB" -> "RGB"],
          Sphere[trans[phi, t vb, #], .05]} & /@ data,
       PlotRange -> {{0, 1}, {-1, 1}, {-1, 1}}, Axes -> True,
       AxesLabel -> {"L", "A", "B"}, ImageSize -> 300,
       Lighting -> "Neutral"],
      Column[
       Row[{Graphics[{RGBColor @@ #, Rectangle[]},
            ImageSize -> {32, 32}],
           toHtml[#]}] & /@ (ColorConvert[trans[phi, t vb, #],
            "LAB" -> "RGB"] & /@ data)
       ]
      }],
    Row[Graphics[{RGBColor@
          ColorConvert[trans[phi, t vb, #], "LAB" -> "RGB"],
         Rectangle[]}, ImageSize -> {32, 64}] & /@ data,
     Background -> (RGBColor @@ ColorConvert[vb, "LAB" -> "RGB"])]
    }]
  ],

 {phi, 0, 2 Pi},
 {{t, 1}, 0, 2},
 {{r, .2}, 0, 1},
 {{n, 10}, 2, 20, 1}]


