2
$\begingroup$

I've generated some confidence intervals for a Q-Q plot in the form of a list plot. However I am having some problems filing between the region. First of all here is the code to generate the intervals:

n = 64;
X = RandomVariate[NormalDistribution[0, 1], n];
\[Mu] = Mean[X];
\[Sigma] = StandardDeviation[X];
\[Alpha] = 0.05;
k = Sqrt[Log[2/\[Alpha]]/(2 n)];

neg = SortBy[Table[{x, InverseCDF[NormalDistribution[\[Mu], \[Sigma]], 1/Length[X] Length[Select[X, # <= x &]] - k]}, {x, X}], #[[2]] &];
pos = SortBy[Table[{x, InverseCDF[NormalDistribution[\[Mu], \[Sigma]], 1/Length[X] Length[Select[X, # <= x &]] + k]}, {x, X}], #[[2]] &];

Show[
        {
            QuantilePlot[X, NormalDistribution[Mean[X], StandardDeviation[X]],ImageSize->Automatic->200, LabelStyle->12, PlotStyle->Red],
            ListLinePlot[{neg, pos}, Filling->{{1->{2}}}, FillingStyle->Directive[{Gray,Opacity[0.1]}]]
    
        }, PlotRange->{{-2,2 }, {-2, 2}}
    ]

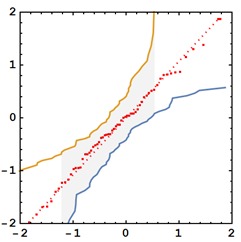
enter image description here

As you can see the filling works as instructed, but it's not what I want. I'd like to fill the region of the plot area which is bounded by the confidence band. I thought I might be able to make a hack by adding an additional diagonal plot which I then hide to reference where the filling occurs. This almost works:

Show[
        {
            QuantilePlot[X, NormalDistribution[Mean[X], StandardDeviation[X]],ImageSize->Automatic->200, LabelStyle->12, PlotStyle->Red],
            ListLinePlot[{neg, pos, Table[{x, x}, {x, -3, 3}]},  Filling->{{1->{3}}, {2->{3}}}, FillingStyle->Directive[{Gray,Opacity[0.1]}]]
        }, PlotRange->{{-2,2 }, {-2, 2}}
    ]

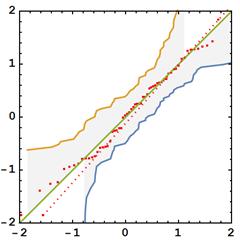
This gets me closer,but I have these regions missing in the corners:

enter image description here

$\endgroup$
3
  • $\begingroup$ Look at your data. E.g. data in "pos" has only points from x==-2 up to x==1.Therefore, you can not have filling to points that do not exists. Similar thing with "neg" $\endgroup$ Commented Nov 3, 2020 at 17:30
  • 1
    $\begingroup$ The problem is that 1/Length[X] Length[Select[X, # <= x &]] - k] and 1/Length[X] Length[Select[X, # <= x &]] - k] can give values less than 0 and greater than 1, respectively. And such values don't work with InverseCDF (which need to be between 0 and 1). A crude fix is to use something like Min[0.999999, Max[0.000001, 1/Length[X] Length[Select[X, # <= x &]] - k]]] and Min[0.999999, Max[0.000001, 1/Length[X] Length[Select[X, # <= x &]] + k]]]. Zero and one can't be used because that gets you −∞ and +∞ $\endgroup$
    – JimB
    Commented Nov 3, 2020 at 17:56
  • $\begingroup$ This turned out to be the easiest fix, thanks again @JimB. I'm accepting Jean-Pierre's answer as I found it useful for other things. $\endgroup$
    – user27119
    Commented Nov 4, 2020 at 18:06

2 Answers 2

4
$\begingroup$

Reverse cheating:

Show[{QuantilePlot[X, 
   NormalDistribution[Mean[X], StandardDeviation[X]], 
   ImageSize -> Automatic -> 200, LabelStyle -> 12, PlotStyle -> Red],
   Graphics[{Opacity[0.1], Gray, Rectangle[{-2, -2}, {2, 2}]}], 
  ListLinePlot[{neg, pos}, Filling -> {1 -> -2, 2 -> 2},
   FillingStyle -> White]}, PlotRange -> {{-2, 2}, {-2, 2}}]

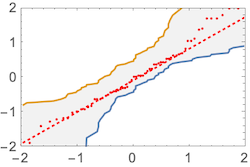
enter image description here

$\endgroup$
4
$\begingroup$

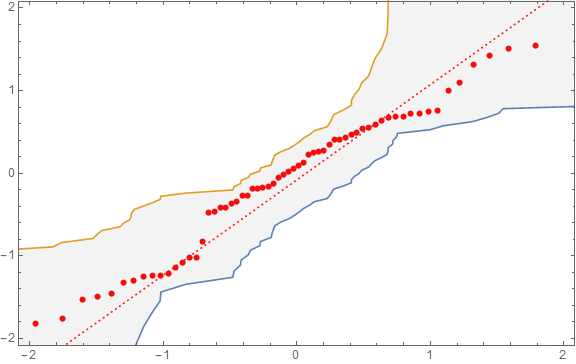
(1) Remove pairs with non-numeric elements from neg and pos, (2) Prepend (Append) neg (pos) with a point so that both series have the same horizontal and vertical ranges:

newpoints = Transpose @ CoordinateBounds[Join @@ (Cases[{__Real}] /@ {neg, pos})];

negpos = MapThread[# @ #2 &] @ 
 {{Prepend[First @ newpoints], Append[Last @ newpoints]}, Cases[{__Real}] /@ {neg, pos}}


Show[{QuantilePlot[X, NormalDistribution[Mean[X], StandardDeviation[X]], 
   ImageSize -> Automatic -> 200, LabelStyle -> 12, PlotStyle -> Red],
   ListLinePlot[negpos, Filling -> {{1 -> {2}}}, 
   FillingStyle -> Directive[{Gray, Opacity[0.1]}]]}, 
 PlotRange -> {{-2, 2}, {-2, 2}}, ImageSize -> Large]

enter image description here

$\endgroup$

Your Answer

By clicking “Post Your Answer”, you agree to our terms of service and acknowledge you have read our privacy policy.

Not the answer you're looking for? Browse other questions tagged or ask your own question.