3
$\begingroup$

I'm trying to draw a seven-patch geometry, where some parts need to be filled. The domain itself is no problem, I have the corner points and just plot lines between them. Now I need that the space between two of these lines is filled. How to do this best? I tried to figure it out for hours, but I still fail. The points are given as:

{px0, py0} = {1/5, 2/5}; {px1, py1} = {1/10, -2/5};{px4, py4} = {9/10, -3/10}; {px5, py5} = {6/5, 9/10};

More precisely, I want the space between the following lines in gray

g10 = ListLinePlot[{{px0, py0}, {px5, py5}}, PlotStyle -> {Thick, Blue}]; g11 = ListLinePlot[{{px1, py1}, {px4, py4}}, PlotStyle -> {Thick, Blue}];
$\endgroup$
2
  • $\begingroup$ Did you try the Filling option? $\endgroup$
    – bill s
    Commented Mar 30, 2015 at 17:45
  • $\begingroup$ Yes, tried several ways... But I never got it right, probably someone can explain to me, how to do it in my case. All examples I found, where for curves, with some kind of a function. I just have those lines... $\endgroup$
    – Kathi
    Commented Mar 30, 2015 at 17:57

4 Answers 4

2
$\begingroup$

To get more flexibility, I would avoid ListLinePlot and use Line and Polygon directly as follows:

points1 = {{px0, py0}, {px5, py5}};

points2 = {{px1, py1}, {px4, py4}};

g10 = Graphics[{Thick, Blue, Line[points1]}]; g11 = 
 Graphics[{Thick, Blue, Line[points2]}];

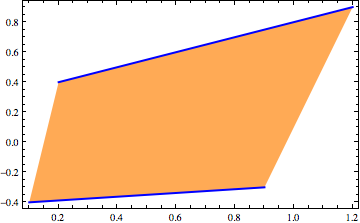
poly = Graphics[{Lighter[Orange], 
    Polygon[Join[points1, Reverse[points2]]]}];

Show[poly, g11, g10, PlotRange -> All, AspectRatio -> 1/GoldenRatio, 
 Frame -> True]

poly

If you want the sides of the polygon to be drawn as lines, you can add a directive like EdgeForm[Black] to the definition of poly. The Reverse in Polygon is needed to make the corner points encircle the polygon in a definite sense.

$\endgroup$
4
$\begingroup$

With version 10:

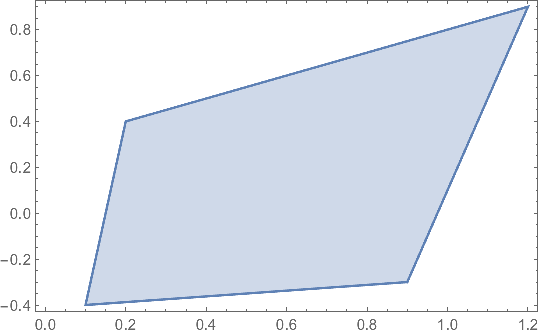
pts = {{1/5, 2/5}, {1/10, -2/5}, {9/10, -3/10}, {6/5, 9/10}};

RegionPlot[ConvexHullMesh[pts], AspectRatio -> 1/GoldenRatio]

enter image description here

$\endgroup$
3
$\begingroup$
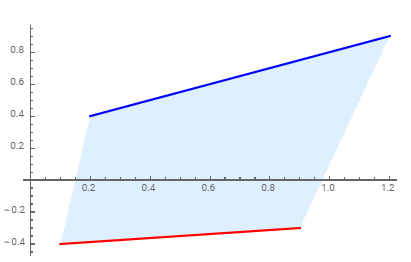
l1 = {{px0, py0}, {px5, py5}};
l2 = {{px1, py1}, {px4, py4}};
ListLinePlot[{l1, l2, Prepend[l1, First@l2], Append[l2, Last@l1]}, 
  PlotStyle -> {Directive[Thick, Blue], Directive[Thick, Red], None, None},
  Filling -> {3 -> {{4}, LightBlue}}]

enter image description here

$\endgroup$
1
$\begingroup$

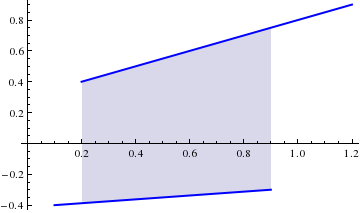
The trick is that you have plot them together.

l1 = {{px0, py0}, {px5, py5}};
l2 = {{px1, py1}, {px4, py4}};
ListLinePlot[{l1, l2}, PlotStyle -> Directive[Thick, Blue], Filling -> {1 -> {2}}]

And here you go

enter image description here

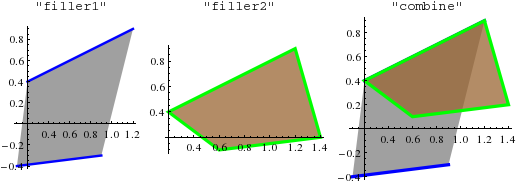
Modification

I hope you are asking for something like this

l1 = {{px0, py0}, {px5, py5}};
l2 = {{px1, py1}, {px4, py4}};
l3 = {{px1 + 1/2, py1 + 1/2}, {px4 + 1/2, py4 + 1/2}};(*I just make it*)

filler1[list1__, list2__, col1_, col2_, lthick_] := Graphics[{col2, Opacity[0.75], Polygon[Join[list1, Reverse[list2]]], Thickness[lthick], col1, Opacity[1], Line[list1], Line[list2]}, Axes -> True]

filler2[list1__, list2__, col1_, col2_, lthick_] := Graphics[{col2, EdgeForm[{Thickness[lthick], col1}], Opacity[0.75], Polygon[Join[list1, Reverse[list2]]]}, Axes -> True]

(*lthick is the line thickness*)

plot1 = filler1[l1, l2, Blue, Gray, 0.02]
plot2 = filler2[l1, l3, Green, Brown, 0.02]
Show[plot1, plot2]

enter image description here

So you can choose either filler1 or filler2 depending on what kind edge you want, make all the plots and then combine them.

$\endgroup$
4
  • $\begingroup$ Thanks for the quick answers, but I'd need, that the whole area between the lines is filled. So from the the endpoints of the upper curve, to the endpoints of the lower one. $\endgroup$
    – Kathi
    Commented Mar 30, 2015 at 18:09
  • $\begingroup$ In the end, I have a geometry, which consists of seven patches, which are all bound by four points, just like the ones I gave as an example here. Therefore I draw lines between the cornerpoints. Each patch is supposed to be filled by different colours. Is it clear, what I mean? $\endgroup$
    – Kathi
    Commented Mar 30, 2015 at 18:13
  • $\begingroup$ Thanks, that's exactly what I was hoping for! $\endgroup$
    – Kathi
    Commented Mar 30, 2015 at 19:13
  • $\begingroup$ you are welcome. BTW, if you want to plot it without axes, just change the Axes part in the filler. And depending on the location of your patches, you may have to add a suitable PlotRange in filler to make all of them appear properly when you are combining them by Show. $\endgroup$
    – Sumit
    Commented Mar 30, 2015 at 19:20

Your Answer

By clicking “Post Your Answer”, you agree to our terms of service and acknowledge you have read our privacy policy.

Not the answer you're looking for? Browse other questions tagged or ask your own question.