deleted 10 characters in body
Source Link
kglr
  • 400.5k
  • 18
  • 488
  • 929

(1) Remove pairs with non-numeric elements from neg and pos, (2) Prepend (Append) neg (pos) with a point so that both series have the same horizontal and vertical ranges:

newpoints = Transpose @
  CoordinateBounds[Join @@ CoordinateBounds[Join[Cases[(Cases[{__Real}]@pos,] Cases[/@ {__Real}]@neg, neg]];pos})];

negpos = {Prepend[FirstMapThread[# @ newpoints]#2 &] @ Cases[neg, 
 {__Real}], 
{Prepend[First @ newpoints], Append[Last @ newpoints] @ Cases[pos}, Cases[{__Real}] /@ {neg, pos};}


Show[{QuantilePlot[X, NormalDistribution[Mean[X], StandardDeviation[X]], 
   ImageSize -> Automatic -> 200, LabelStyle -> 12, PlotStyle -> Red],
   ListLinePlot[negpos, Filling -> {{1 -> {2}}}, 
   FillingStyle -> Directive[{Gray, Opacity[0.1]}]]}, 
 PlotRange -> {{-2, 2}, {-2, 2}}, ImageSize -> Large]

enter image description here

(1) Remove pairs with non-numeric elements from neg and pos, (2) Prepend (Append) neg (pos) with a point so that both series have the same horizontal and vertical ranges:

newpoints = Transpose @
    CoordinateBounds[Join[Cases[{__Real}]@pos, Cases[{__Real}]@ neg]];

negpos = {Prepend[First @ newpoints] @ Cases[neg, {__Real}], 
   Append[Last @ newpoints] @ Cases[pos, {__Real}]};


Show[{QuantilePlot[X, NormalDistribution[Mean[X], StandardDeviation[X]], 
   ImageSize -> Automatic -> 200, LabelStyle -> 12, PlotStyle -> Red],
   ListLinePlot[negpos, Filling -> {{1 -> {2}}}, 
   FillingStyle -> Directive[{Gray, Opacity[0.1]}]]}, 
 PlotRange -> {{-2, 2}, {-2, 2}}, ImageSize -> Large]
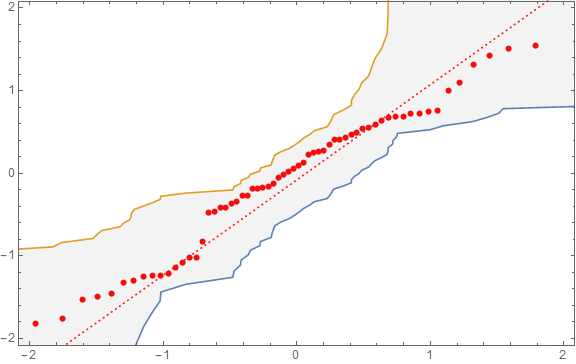
enter image description here

(1) Remove pairs with non-numeric elements from neg and pos, (2) Prepend (Append) neg (pos) with a point so that both series have the same horizontal and vertical ranges:

newpoints = Transpose @ CoordinateBounds[Join @@ (Cases[{__Real}] /@ {neg, pos})];

negpos = MapThread[# @ #2 &] @  
 {{Prepend[First @ newpoints], Append[Last @ newpoints]}, Cases[{__Real}] /@ {neg, pos}}


Show[{QuantilePlot[X, NormalDistribution[Mean[X], StandardDeviation[X]], 
   ImageSize -> Automatic -> 200, LabelStyle -> 12, PlotStyle -> Red],
   ListLinePlot[negpos, Filling -> {{1 -> {2}}}, 
   FillingStyle -> Directive[{Gray, Opacity[0.1]}]]}, 
 PlotRange -> {{-2, 2}, {-2, 2}}, ImageSize -> Large]

enter image description here

added 143 characters in body
Source Link
kglr
  • 400.5k
  • 18
  • 488
  • 929

(1) Remove pairs with non-numeric elements from neg and pos, (2) Prepend (Append) neg (pos) with a point so that both series have the same horizontal and vertical ranges:

newpoints = Transpose @
   CoordinateBounds[Join[Cases[{__Real}]@pos, Cases[{__Real}]@ neg]];

negpos = {Prepend[First @ newpoints] @ Cases[neg, {__Real}], 
   Append[Last @ newpoints] @ Cases[pos, {__Real}]};


Show[{QuantilePlot[X, NormalDistribution[Mean[X], StandardDeviation[X]], 
   ImageSize -> Automatic -> 200, LabelStyle -> 12, PlotStyle -> Red],
   ListLinePlot[{Prepend[{-3, -3}]@Cases[neg, {__Real}],
      Append[{3, 3}]@Cases[pos, {__Real}]}ListLinePlot[negpos,
   Filling -> {{1 -> {2}}}, 
   FillingStyle -> Directive[{Gray, Opacity[0.1]}]]}, 
 PlotRange -> {{-2, 2}, {-2, 2}}, ImageSize -> Large]

enter image description here

(1) Remove pairs with non-numeric elements from neg and pos, (2) Prepend (Append) neg (pos) with a point so that both series have the same horizontal and vertical ranges:

Show[{QuantilePlot[X, NormalDistribution[Mean[X], StandardDeviation[X]], 
   ImageSize -> Automatic -> 200, LabelStyle -> 12, PlotStyle -> Red],
   ListLinePlot[{Prepend[{-3, -3}]@Cases[neg, {__Real}],
      Append[{3, 3}]@Cases[pos, {__Real}]},
   Filling -> {{1 -> {2}}}, 
   FillingStyle -> Directive[{Gray, Opacity[0.1]}]]}, 
 PlotRange -> {{-2, 2}, {-2, 2}}, ImageSize -> Large]

enter image description here

(1) Remove pairs with non-numeric elements from neg and pos, (2) Prepend (Append) neg (pos) with a point so that both series have the same horizontal and vertical ranges:

newpoints = Transpose @
   CoordinateBounds[Join[Cases[{__Real}]@pos, Cases[{__Real}]@ neg]];

negpos = {Prepend[First @ newpoints] @ Cases[neg, {__Real}], 
   Append[Last @ newpoints] @ Cases[pos, {__Real}]};


Show[{QuantilePlot[X, NormalDistribution[Mean[X], StandardDeviation[X]], 
   ImageSize -> Automatic -> 200, LabelStyle -> 12, PlotStyle -> Red],
   ListLinePlot[negpos, Filling -> {{1 -> {2}}}, 
   FillingStyle -> Directive[{Gray, Opacity[0.1]}]]}, 
 PlotRange -> {{-2, 2}, {-2, 2}}, ImageSize -> Large]

enter image description here

deleted 90 characters in body
Source Link
kglr
  • 400.5k
  • 18
  • 488
  • 929

(1) Remove pairs with non-numeric elements from neg and pos, (2) Prepend (Append) neg (pos) with a point so that both series have the same horizontal and vertical ranges, and (3) add the option ClippingStyle -> False in Show:

Show[{QuantilePlot[X, NormalDistribution[Mean[X], StandardDeviation[X]], 
   ImageSize -> Automatic -> 200, LabelStyle -> 12, PlotStyle -> Red],
   ListLinePlot[{Prepend[{-3, -3}]@Cases[neg, {__Real}],
      Append[{3, 3}]@Cases[pos, {__Real}]},
   Filling -> {{1 -> {2}}}, 
   FillingStyle -> Directive[{Gray, Opacity[0.1]}]]}, 
 PlotRange -> {{-2, 2}, {-2, 2}}, ImageSize -> Large, 
 ClippingStyle -> False]Large]

enter image description here

(1) Remove pairs with non-numeric elements from neg and pos, (2) Prepend (Append) neg (pos) with a point so that both series have the same horizontal and vertical ranges, and (3) add the option ClippingStyle -> False in Show:

Show[{QuantilePlot[X, NormalDistribution[Mean[X], StandardDeviation[X]], 
   ImageSize -> Automatic -> 200, LabelStyle -> 12, PlotStyle -> Red],
   ListLinePlot[{Prepend[{-3, -3}]@Cases[neg, {__Real}],
      Append[{3, 3}]@Cases[pos, {__Real}]},
   Filling -> {{1 -> {2}}}, 
   FillingStyle -> Directive[{Gray, Opacity[0.1]}]]}, 
 PlotRange -> {{-2, 2}, {-2, 2}}, ImageSize -> Large, 
 ClippingStyle -> False]

enter image description here

(1) Remove pairs with non-numeric elements from neg and pos, (2) Prepend (Append) neg (pos) with a point so that both series have the same horizontal and vertical ranges:

Show[{QuantilePlot[X, NormalDistribution[Mean[X], StandardDeviation[X]], 
   ImageSize -> Automatic -> 200, LabelStyle -> 12, PlotStyle -> Red],
   ListLinePlot[{Prepend[{-3, -3}]@Cases[neg, {__Real}],
      Append[{3, 3}]@Cases[pos, {__Real}]},
   Filling -> {{1 -> {2}}}, 
   FillingStyle -> Directive[{Gray, Opacity[0.1]}]]}, 
 PlotRange -> {{-2, 2}, {-2, 2}}, ImageSize -> Large]

enter image description here

Source Link
kglr
  • 400.5k
  • 18
  • 488
  • 929
Loading